Revenue per Employee Calculator: Measure Business Efficiency & Performance
Calculate and analyze your company's revenue per employee with our interactive tool. Compare results against industry standards in technology, finance, retail, and manufacturing sectors to evaluate operational efficiency and identify areas for improvement. Get instant insights into your business performance with clear comparative analysis.
Analysis Results
Revenue per Employee:
Industry Average:
Performance vs Industry:
★ Add to Home Screen
×
Follow these steps:
Tap the Share button at the bottom of the browser
Scroll down and tap “Add to Home Screen”
Tap “Add” to confirm
Follow these steps:
Tap the menu icon (⋮) in the top right
Tap “Add to Home screen”
Tap “Add” to confirm
Follow these steps:
Click the menu icon (⋮) in the top right
Click “Bookmarks”
Click “Bookmark this tab” or press Ctrl+D (Cmd+D on Mac)
Is this tool helpful?
Thanks for your feedback!
How to Use the Revenue per Employee Calculator Effectively
This comprehensive revenue per employee calculator helps analyze your company’s operational efficiency through three simple steps:
Step 1: Enter your company’s annual revenue in USD (e.g., $5,750,000 or $12,450,000)
Step 2: Input the total number of full-time employees (FTE) (e.g., 25 or 47)
Step 3: Select your industry from the dropdown menu (Technology, Finance, Retail, or Manufacturing)
The calculator will instantly provide your revenue per employee, compare it to industry averages, and show your performance relative to the industry benchmark.
Understanding Revenue per Employee Analysis
Revenue per employee is a crucial metric that measures how efficiently a company generates revenue through its workforce. The formula for this calculation is:
$$
\text{Revenue per Employee} = \frac{\text{Annual Revenue}}{\text{Number of Full-Time Employees}}
$$
This metric serves as a key performance indicator (KPI) for operational efficiency and productivity across different business sectors.
Industry Benchmarks
Different industries have varying revenue per employee benchmarks:
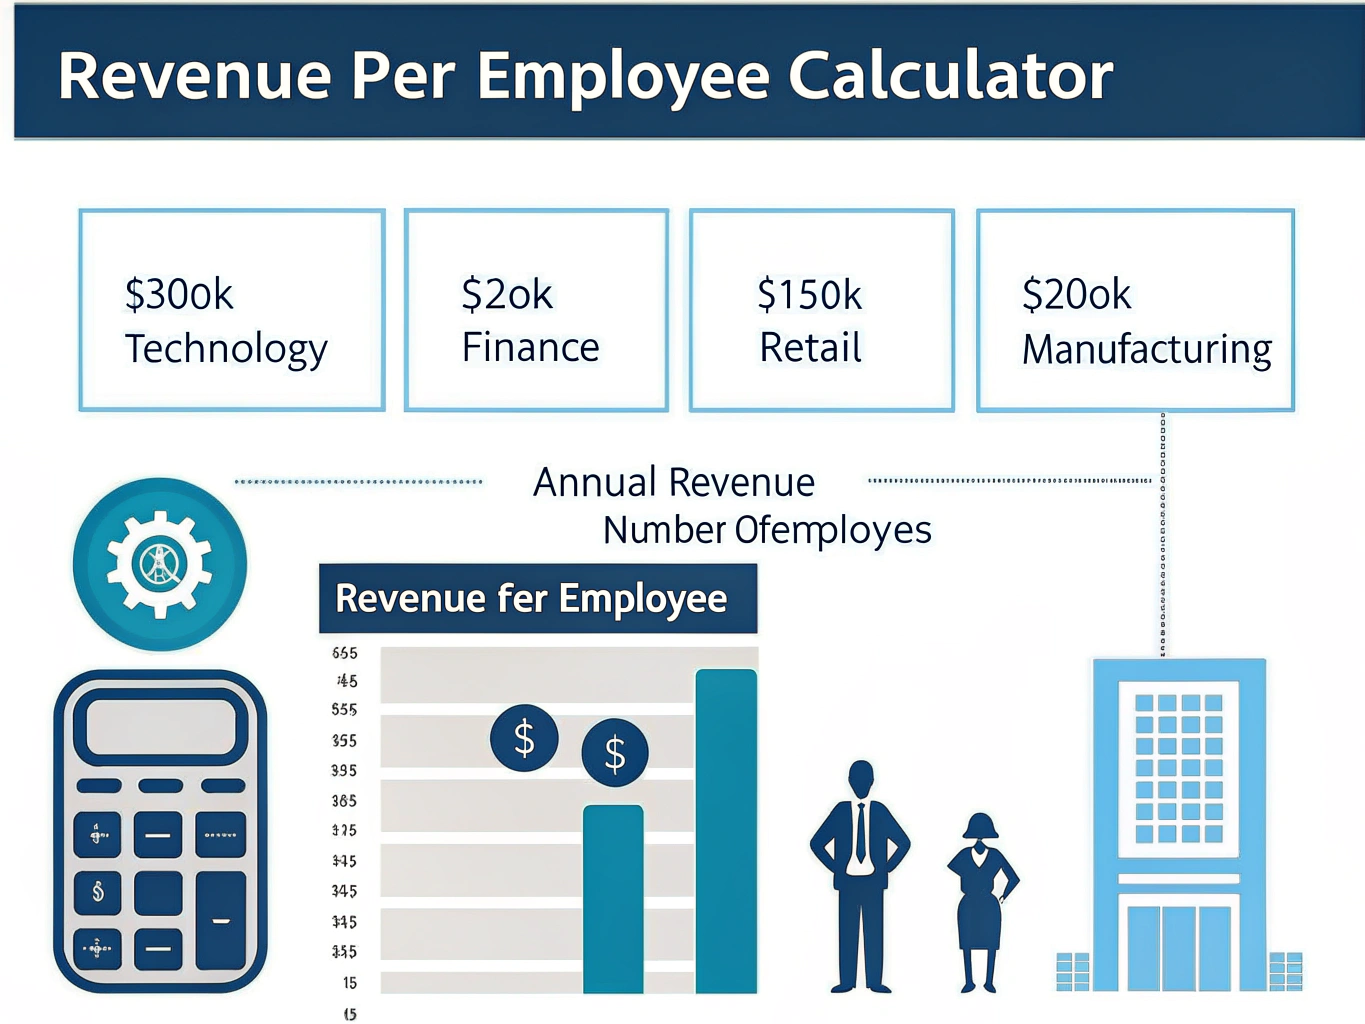
Technology: $300,000 per employee
Finance: $250,000 per employee
Retail: $150,000 per employee
Manufacturing: $200,000 per employee
Benefits of Using the Revenue per Employee Calculator
1. Strategic Decision Making
Identify operational inefficiencies
Guide hiring decisions
Support resource allocation
Benchmark against competitors
2. Performance Monitoring
Track productivity trends
Measure organizational efficiency
Evaluate business model effectiveness
Monitor growth sustainability
3. Business Planning
Optimize workforce planning
Guide expansion strategies
Support budget allocation
Enhance investment decisions
Practical Applications and Problem Solving
Case Study 1: Technology Startup
Consider a growing tech startup with annual revenue of $8,400,000 and 24 employees. Using the calculator:
Revenue per Employee = $8,400,000 ÷ 24 = $350,000
Comparison to Industry Average: 16.7% above technology sector average
Indicates strong operational efficiency and scalable business model
Case Study 2: Retail Chain
A retail business generating $4,500,000 annually with 35 employees:
Revenue per Employee = $4,500,000 ÷ 35 = $128,571
Comparison to Industry Average: 14.3% below retail sector average
Suggests need for operational optimization or process improvement
Strategic Implementation Guidelines
1. Performance Optimization
Regular monitoring of revenue per employee trends
Implementation of efficiency improvement programs
Development of productivity enhancement strategies
2. Resource Management
Balanced workforce planning
Strategic hiring decisions
Optimal resource allocation
3. Growth Planning
Scaling strategies development
Market expansion analysis
Investment planning optimization
Industry-Specific Considerations
Technology Sector
High revenue per employee expectations due to:
Scalable digital products
Automation capabilities
High-value intellectual property
Financial Services
Moderate to high revenue per employee driven by:
High-value transactions
Specialized expertise
Complex service offerings
Retail Sector
Lower revenue per employee due to:
Labor-intensive operations
Lower profit margins
High employee count requirements
Frequently Asked Questions
What is a good revenue per employee ratio?
A good ratio varies by industry. Technology companies typically aim for $300,000 or higher, while retail businesses might target $150,000 per employee. The key is to compare your performance against industry-specific benchmarks.
How often should I calculate revenue per employee?
Best practice is to calculate this metric quarterly or annually to track trends and make informed decisions about hiring, resource allocation, and operational efficiency.
Can this metric help with hiring decisions?
Yes, revenue per employee helps determine if adding staff will maintain or improve operational efficiency. It provides insights into optimal staffing levels for your business model.
Should part-time employees be included in the calculation?
Convert part-time employees to full-time equivalents (FTE) for accurate calculations. For example, two half-time employees equal one FTE.
How can I improve my revenue per employee ratio?
Improvement strategies include:
Implementing automation and efficiency tools
Optimizing business processes
Providing employee training and development
Focusing on high-value products or services
Streamlining operations and reducing redundancies
Does company size affect the revenue per employee metric?
Yes, companies of different sizes may have varying revenue per employee ratios due to economies of scale, operational efficiency, and business model differences. Compare with similar-sized companies in your industry for meaningful insights.
Important Disclaimer
The calculations, results, and content provided by our tools are not guaranteed to be accurate, complete, or reliable. Users are responsible for verifying and interpreting the results. Our content and tools may contain errors, biases, or inconsistencies. We reserve the right to save inputs and outputs from our tools for the purposes of error debugging, bias identification, and performance improvement. External companies providing AI models used in our tools may also save and process data in accordance with their own policies. By using our tools, you consent to this data collection and processing. We reserve the right to limit the usage of our tools based on current usability factors. By using our tools, you acknowledge that you have read, understood, and agreed to this disclaimer. You accept the inherent risks and limitations associated with the use of our tools and services.