Risk Premium Calculator
Is this tool helpful?
How to use the tool
- Enter Expected Return (%): Type the projected gain for your asset, e.g., 8.40 % for a dividend stock or 15.75 % for a biotech ETF.
- Enter Risk-Free Rate (%): Add today’s yield on a Treasury bill, such as 1.10 % (4-week bill) or 3.40 % (10-year note).
- Press “Calculate”: The calculator displays your risk premium in real time and stores both inputs in your browser for next visit.
- Interpret the number: A higher premium signals you require more compensation for risk; compare across assets to rank opportunities.
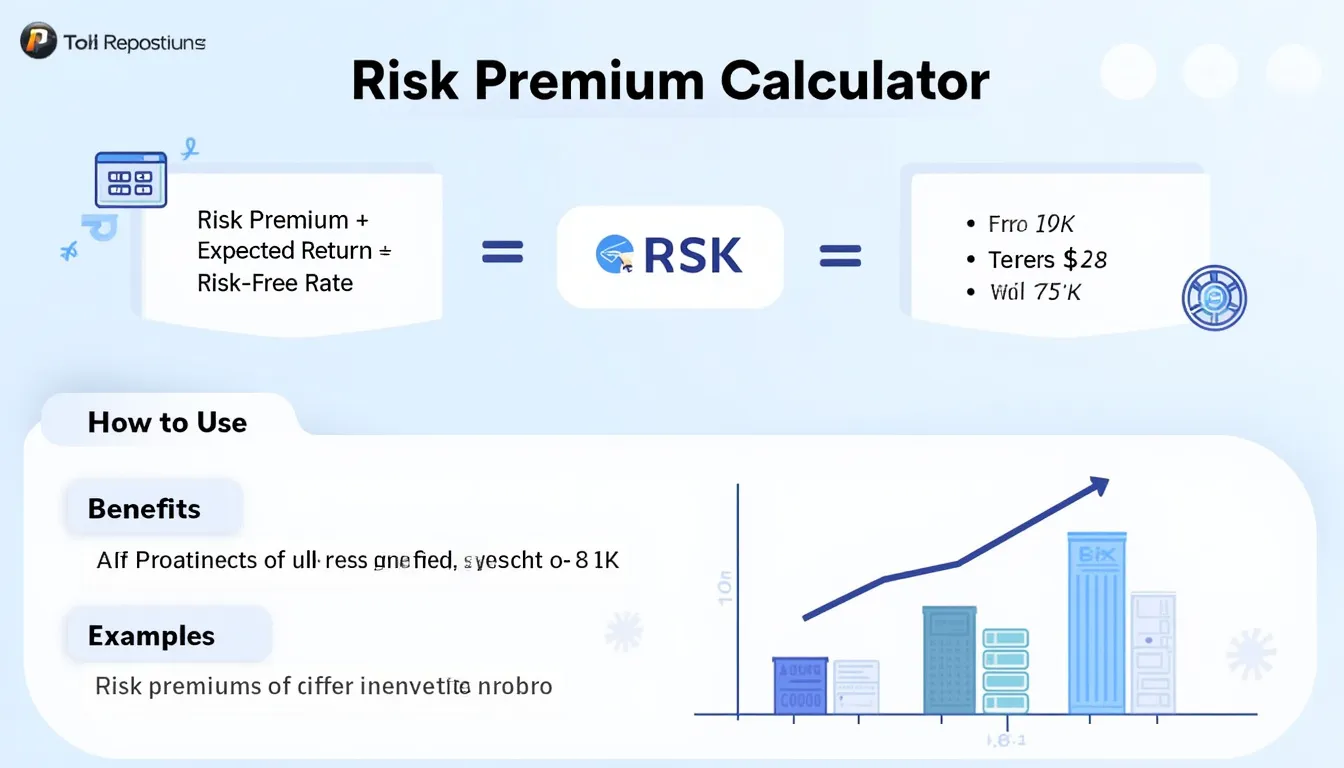
Formula
$$ \text{Risk Premium}= \text{Expected Return}-\text{Risk-Free Rate} $$
Example calculations
- Corporate bond: 6.25 % − 2.10 % = 4.15 %
- Growth stock: 14.80 % − 3.20 % = 11.60 %
- REIT: 9.05 % − 1.75 % = 7.30 %
Quick-Facts
- Average U.S. equity risk premium: 5.5 % (Damodaran, 2023).
- Current 10-year Treasury yield about 3.8 % (U.S. Treasury, 2023).
- CAPM uses risk premium to price assets (Sharpe, 1964).
- Inputs accepted: 0 %-100 %; negative values rejected (W3C HTML 5.3).
FAQ
What is a risk premium?
The risk premium is the extra return you require over the risk-free rate to hold a risky asset, forming the core of risk-adjusted performance metrics (Investopedia, 2023).
How do I interpret a negative risk premium?
A negative value means the expected return lags the risk-free rate; rational investors usually avoid such assets unless they offer non-monetary benefits (CFA Institute, 2020).
Where can I find the current risk-free rate?
Use yields on short-dated U.S. Treasury bills, updated daily on the Treasury’s website (U.S. Treasury, 2023).
How does the risk premium fit into CAPM?
CAPM multiplies the market risk premium by beta and adds the risk-free rate to estimate expected return (Sharpe, 1964).
Is my data stored securely?
The calculator saves inputs only in your browser’s local storage; no data leaves your device (MDN Web Docs, 2023).
Why can expected returns vary widely?
They rely on analysts’ forecasts, historical averages, or discounted cash-flow models, each subject to economic conditions (Morningstar, 2022).
What if the risk premium seems too high?
Re-check cash-flow assumptions; unusually high premiums may reflect optimistic forecasts or heightened market volatility (S&P Global, 2023).
Can I evaluate multiple assets quickly?
Yes. Change the two inputs for each asset; the tool instantly updates without page reload, streamlining comparison across positions (MDN Web Docs, 2023).
Important Disclaimer
The calculations, results, and content provided by our tools are not guaranteed to be accurate, complete, or reliable. Users are responsible for verifying and interpreting the results. Our content and tools may contain errors, biases, or inconsistencies. Do not enter personal data, sensitive information, or personally identifiable information in our web forms or tools. Such data entry violates our terms of service and may result in unauthorized disclosure to third parties. We reserve the right to save inputs and outputs from our tools for the purposes of error debugging, bias identification, and performance improvement. External companies providing AI models used in our tools may also save and process data in accordance with their own policies. By using our tools, you consent to this data collection and processing. We reserve the right to limit the usage of our tools based on current usability factors.