Sortino Ratio Calculator
Is this tool helpful?
How to Use the Sortino Ratio Calculator Effectively
To calculate the Sortino ratio using our tool, follow these simple steps:
- Portfolio Return (%): Enter your investment portfolio’s return rate. For example, if your portfolio gained 15.75%, enter 15.75.
- Risk-Free Rate (%): Input the current risk-free rate, such as the yield on a 3-month Treasury bill. For instance, enter 3.25 for a 3.25% rate.
- Downside Deviation (%): Enter your portfolio’s downside deviation. If your downside deviation is 12.5%, input 12.5.
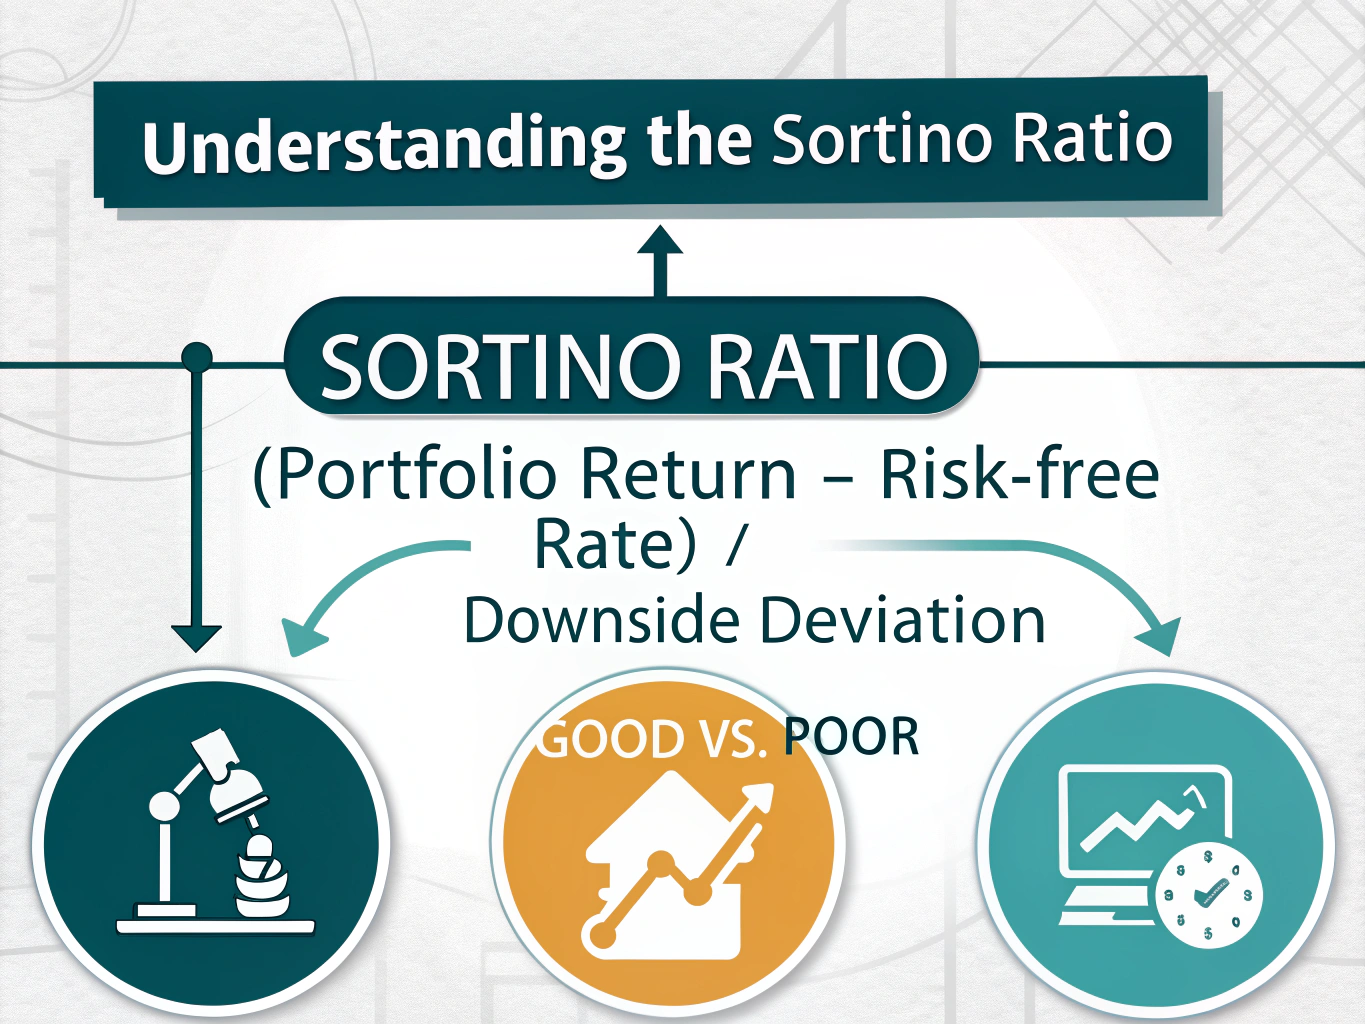
Understanding the Sortino Ratio
The Sortino ratio is a sophisticated variation of the Sharpe ratio that helps investors evaluate portfolio performance by focusing specifically on downside volatility. It measures the risk-adjusted return of an investment portfolio by comparing the excess return (over the risk-free rate) to the downside deviation.
$$ \text{Sortino Ratio} = \frac{\text{Portfolio Return} – \text{Risk-Free Rate}}{\text{Downside Deviation}} $$Components of the Sortino Ratio
- Portfolio Return: The total return generated by your investment portfolio over a specific period
- Risk-Free Rate: The return available from a risk-free investment, typically Treasury bills
- Downside Deviation: A measure of negative volatility that focuses only on returns below a specified target or minimum acceptable return
Benefits of Using the Sortino Ratio Calculator
- Better risk assessment by focusing on harmful volatility
- More accurate evaluation of investment strategies
- Enhanced portfolio optimization capabilities
- Improved decision-making for risk-averse investors
- Quick and precise calculations for complex portfolio analysis
Advantages Over Traditional Metrics
The Sortino ratio offers several advantages over traditional performance metrics:
- Distinguishes between good and bad volatility
- Provides more relevant information for downside risk-focused investors
- Better suited for asymmetric return distributions
- More appropriate for portfolios with alternative investments
Practical Applications and Problem-Solving
The Sortino ratio calculator addresses various investment challenges:
Portfolio Comparison
Consider two portfolios:
- Portfolio A: Return = 18%, Risk-free rate = 3%, Downside deviation = 9% Sortino ratio = (18% – 3%) / 9% = 1.67
- Portfolio B: Return = 14%, Risk-free rate = 3%, Downside deviation = 5% Sortino ratio = (14% – 3%) / 5% = 2.20
Despite lower returns, Portfolio B shows better risk-adjusted performance.
Investment Strategy Validation
The calculator helps validate investment strategies by:
- Quantifying the risk-return trade-off
- Identifying strategies with excessive downside risk
- Comparing performance across different market conditions
Real-World Use Cases
Hedge Fund Evaluation
Investment managers use the Sortino ratio to:
- Compare hedge fund performance
- Evaluate risk management effectiveness
- Assess manager skill in controlling downside risk
Portfolio Management
Portfolio managers utilize the ratio for:
- Asset allocation decisions
- Strategy selection and optimization
- Risk budgeting across different investments
Individual Investor Applications
Retail investors benefit from:
- Mutual fund comparison and selection
- Personal portfolio performance assessment
- Investment strategy validation
Frequently Asked Questions
What is a good Sortino ratio?
Generally, a Sortino ratio above 1 is considered good, above 2 is very good, and above 3 is excellent. However, the interpretation depends on market conditions and investment objectives.
How often should I calculate the Sortino ratio?
Most investors calculate the Sortino ratio quarterly or annually. However, more frequent calculations may be necessary during periods of market volatility.
How does the Sortino ratio differ from the Sharpe ratio?
While the Sharpe ratio uses standard deviation (total volatility), the Sortino ratio only considers downside deviation, making it more relevant for investors concerned primarily with downside risk.
Can the Sortino ratio be negative?
Yes, the Sortino ratio can be negative when portfolio returns are below the risk-free rate, indicating poor risk-adjusted performance.
Should I use the Sortino ratio alone for investment decisions?
The Sortino ratio should be used alongside other performance metrics and qualitative factors for comprehensive investment analysis.
How does market volatility affect the Sortino ratio?
Higher market volatility typically leads to larger downside deviations, potentially resulting in lower Sortino ratios unless returns increase proportionally.
Best Practices for Using the Sortino Ratio
- Use consistent time periods for all components
- Consider market context when interpreting results
- Compare ratios across similar investment strategies
- Combine with other risk-adjusted return metrics
- Update calculations regularly to reflect current market conditions
Important Disclaimer
The calculations, results, and content provided by our tools are not guaranteed to be accurate, complete, or reliable. Users are responsible for verifying and interpreting the results. Our content and tools may contain errors, biases, or inconsistencies. Do not enter personal data, sensitive information, or personally identifiable information in our web forms or tools. Such data entry violates our terms of service and may result in unauthorized disclosure to third parties. We reserve the right to save inputs and outputs from our tools for the purposes of error debugging, bias identification, and performance improvement. External companies providing AI models used in our tools may also save and process data in accordance with their own policies. By using our tools, you consent to this data collection and processing. We reserve the right to limit the usage of our tools based on current usability factors.