5-Year S&P 500 Rolling Return Calculator: Analyze Market Performance
Use our 5-Year Rolling Return Calculator to analyze S&P 500 performance over time. This tool helps eliminate recency bias by calculating annualized returns and provides visual representation through interactive charts, enabling more informed investment decisions.
5-Year Rolling Return Calculator
5-Year Rolling Return Result
This represents the annualized return over the 5-year period
★ Add to Home Screen
×
Follow these steps:
Tap the Share button at the bottom of the browser
Scroll down and tap “Add to Home Screen”
Tap “Add” to confirm
Follow these steps:
Tap the menu icon (⋮) in the top right
Tap “Add to Home screen”
Tap “Add” to confirm
Follow these steps:
Click the menu icon (⋮) in the top right
Click “Bookmarks”
Click “Bookmark this tab” or press Ctrl+D (Cmd+D on Mac)
Is this tool helpful?
Thanks for your feedback!
How to Use the Rolling Return Analyzer Effectively
The Rolling Return Analyzer is designed to calculate the annualized 5-year rolling returns for S&P 500 investments. To use this tool effectively, follow these steps:
Enter Starting S&P 500 Price: Input the index value at the beginning of your investment period. For example, if you started investing in January 2015, you might enter 2058.20 (the S&P 500 value at that time).
Enter Ending S&P 500 Price: Input the index value at the end of your investment period. For instance, if your period ended in January 2020, you might enter 3329.62.
Review Results: The calculator will display the annualized return and generate a visual representation of the value progression over the five-year period.
Understanding Rolling Returns in Investment Analysis
Rolling returns represent the annualized average rate of return for a specific period, calculated on a rolling basis from one period to the next. This method provides a more comprehensive view of investment performance compared to simple point-to-point returns.
Annualization: Converting total return into yearly performance
Geometric Average: Accounts for compounding effects
Benefits of Using Rolling Returns for Investment Analysis
Rolling returns offer several advantages for investors and analysts:
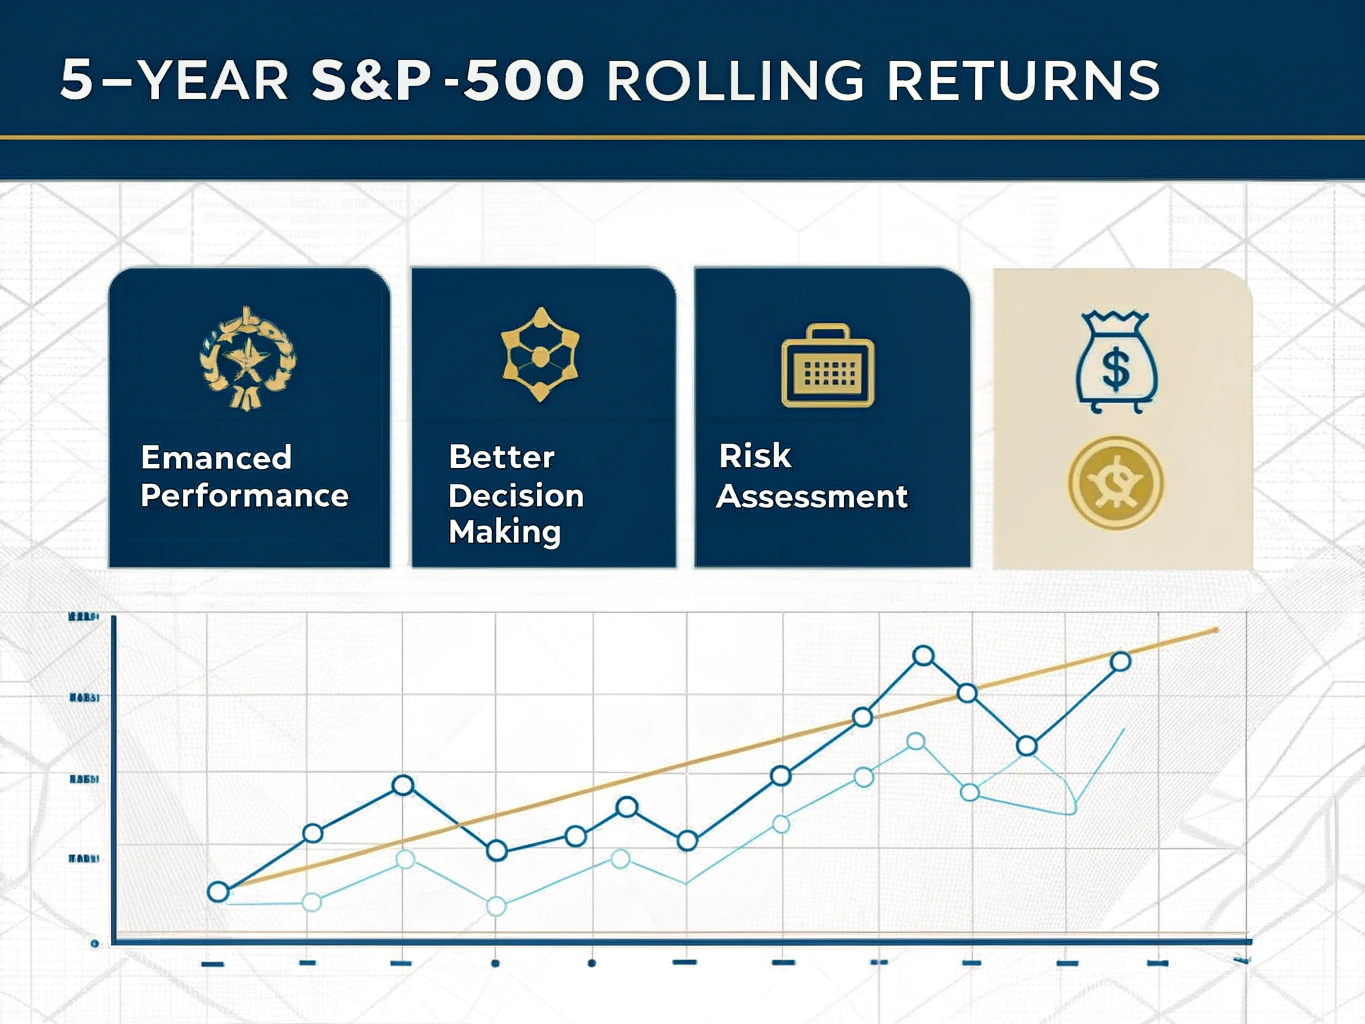
1. Enhanced Performance Perspective
Eliminates endpoint sensitivity bias
Provides a more stable performance metric
Captures multiple market cycles
2. Better Decision Making
Helps set realistic return expectations
Improves investment timing strategies
Supports long-term planning
3. Risk Assessment
Identifies performance patterns
Reveals market cyclicality
Highlights historical volatility
Practical Applications and Example Calculations
Example 1: Market Recovery Analysis
Consider analyzing the market recovery period from 2009 to 2014:
Starting S&P 500 Value (March 2009): 676.53
Ending S&P 500 Value (March 2014): 1872.34
5-Year Rolling Return: 22.6% annualized
Example 2: Bull Market Performance
Examining the bull market period of 2013-2018:
Starting S&P 500 Value (January 2013): 1498.11
Ending S&P 500 Value (January 2018): 2872.87
5-Year Rolling Return: 13.9% annualized
Use Cases for Rolling Return Analysis
1. Portfolio Performance Evaluation
Investment managers use rolling returns to:
Compare fund performance against benchmarks
Evaluate consistency of returns
Assess investment strategies across market cycles
2. Financial Planning
Financial advisors utilize rolling returns for:
Setting realistic client expectations
Developing retirement planning strategies
Illustrating long-term investment potential
3. Market Research
Analysts employ rolling returns to:
Identify market trends
Study historical patterns
Develop investment theses
Frequently Asked Questions
What are rolling returns?
Rolling returns are annualized average returns for a specific time period, calculated by “rolling” the time window forward. This method provides a series of overlapping periods, offering a more comprehensive view of investment performance.
Why use 5-year rolling returns?
Five-year periods are long enough to smooth out short-term market volatility while being short enough to remain relevant for most investment planning horizons. This timeframe captures both bull and bear market cycles.
How do rolling returns differ from traditional returns?
Traditional returns measure point-to-point performance between two specific dates. Rolling returns consider multiple overlapping periods, providing a more robust analysis of investment performance across different market conditions.
Can I use rolling returns for other investments?
Yes, rolling returns can be calculated for any investment with regular price data, including individual stocks, mutual funds, ETFs, and other market indices.
How should I interpret the results?
The rolling return percentage represents the annualized rate of return over the five-year period. A 10% rolling return means the investment grew at an average rate of 10% per year over the five-year period, accounting for compounding.
Are rolling returns useful for market timing?
While rolling returns provide valuable historical context, they should be used as one of many tools for investment decision-making rather than as a sole timing indicator.
Additional Tips for Using the Rolling Return Analyzer
1. Data Selection
Use consistent data sources for price inputs
Consider dividend-adjusted prices for total return analysis
Verify historical data points for accuracy
2. Analysis Best Practices
Compare results across different time periods
Consider market conditions during the analysis period
Use rolling returns alongside other analytical tools
3. Interpretation Guidelines
Focus on long-term trends rather than individual data points
Consider the broader economic context
Use results to inform, not dictate, investment decisions
Important Disclaimer
The calculations, results, and content provided by our tools are not guaranteed to be accurate, complete, or reliable. Users are responsible for verifying and interpreting the results. Our content and tools may contain errors, biases, or inconsistencies. We reserve the right to save inputs and outputs from our tools for the purposes of error debugging, bias identification, and performance improvement. External companies providing AI models used in our tools may also save and process data in accordance with their own policies. By using our tools, you consent to this data collection and processing. We reserve the right to limit the usage of our tools based on current usability factors. By using our tools, you acknowledge that you have read, understood, and agreed to this disclaimer. You accept the inherent risks and limitations associated with the use of our tools and services.