Standard Deviation Calculator: Measure Data Spread with Precision

Unlock the power of data analysis with our Standard Deviation Calculator. From test scores to stock volatility, discover how this versatile tool can revolutionize your decision-making process. Learn to interpret results like a pro and gain valuable insights into your data sets. Ready to elevate your statistical prowess? Dive in now!

Standard Deviation Calculator

Enter numbers separated by commas, spaces, or new lines.

★ Add to Home Screen

Is this tool helpful?

Thanks for your feedback!

How to Use the Standard Deviation Calculator Effectively

Our Standard Deviation Calculator is a powerful tool designed to help you analyze the dispersion of your data set quickly and accurately. Here’s a step-by-step guide on how to use this calculator effectively:

1. Enter Your Data Set

In the “Enter Data Set” field, input your numerical values. You can separate the numbers using commas, spaces, or new lines. For example:

  • Comma-separated: 4, 8, 6, 5, 3
  • Space-separated: 4 8 6 5 3
  • New line-separated: 4 8 6 5 3

The calculator is flexible and can handle various input formats, making it convenient for you to paste data directly from spreadsheets or other sources.

2. Select the Calculation Type

Choose between “Population Standard Deviation” and “Sample Standard Deviation” from the dropdown menu. This selection is crucial as it determines which formula the calculator will use:

  • Population Standard Deviation: Use this when your data set represents the entire population you’re analyzing.
  • Sample Standard Deviation: Select this option when your data set is a sample drawn from a larger population.

3. Click “Calculate”

After entering your data and selecting the calculation type, simply click the “Calculate” button. The calculator will process your input and display the results.

4. Interpret the Results

The calculator will provide you with three key pieces of information:

  • Mean: The average of your data set.
  • Variance: A measure of variability that represents the average squared deviation from the mean.
  • Standard Deviation: The square root of the variance, indicating the average distance between each data point and the mean.

These results will help you understand the spread and central tendency of your data set.

Understanding Standard Deviation: Definition, Purpose, and Benefits

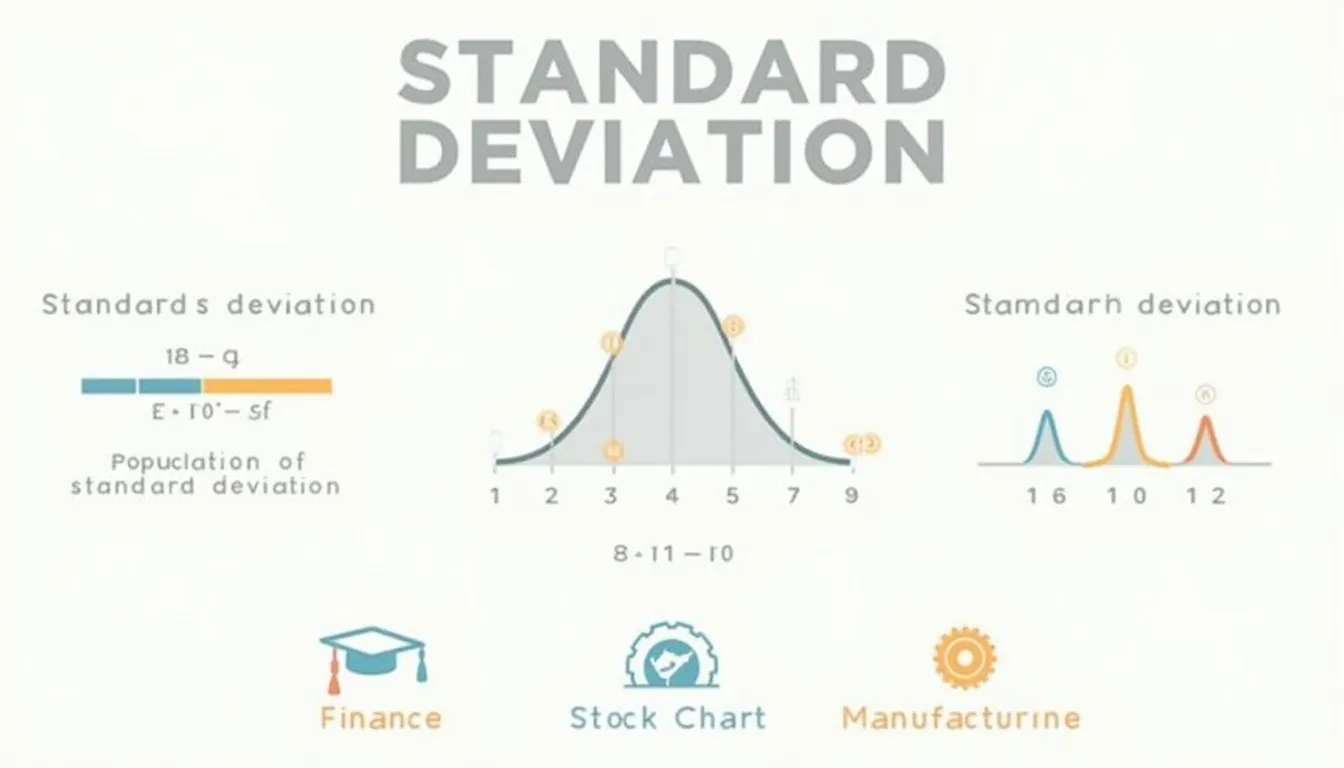
Standard deviation is a fundamental statistical measure that quantifies the amount of variation or dispersion in a set of data values. It provides valuable insights into how spread out the numbers are in relation to the mean (average) of the data set.

Definition and Formula

The standard deviation is calculated using the following formula:

$$ \sigma = \sqrt{\frac{\sum_{i=1}^{N} (x_i – \mu)^2}{N}} $$

Where:

  • σ (sigma) is the standard deviation
  • xi represents each value in the data set
  • μ (mu) is the mean of the data set
  • N is the number of values in the data set

For sample standard deviation, we use (N-1) instead of N in the denominator to account for the degrees of freedom:

$$ s = \sqrt{\frac{\sum_{i=1}^{n} (x_i – \bar{x})^2}{n – 1}} $$

Where s is the sample standard deviation and x̄ is the sample mean.

Purpose of Standard Deviation

The primary purpose of calculating standard deviation is to:

  • Measure the spread of data around the mean
  • Identify outliers and unusual patterns in data sets
  • Compare the variability of different data sets
  • Determine the reliability and consistency of data
  • Make inferences about population parameters based on sample statistics

Benefits of Using Standard Deviation

Understanding and utilizing standard deviation offers numerous benefits across various fields:

  1. Data Analysis: It provides a standardized measure of variability, allowing for meaningful comparisons between different data sets.
  2. Quality Control: In manufacturing, standard deviation helps monitor product consistency and identify process variations.
  3. Financial Management: Investors use standard deviation to assess risk and volatility in stock prices and portfolio returns.
  4. Scientific Research: It helps researchers evaluate the precision of their measurements and the significance of their findings.
  5. Education: Teachers can use standard deviation to analyze test scores and assess the overall performance of their students.
  6. Weather Forecasting: Meteorologists use it to quantify the variability in temperature, rainfall, and other climate data.
  7. Healthcare: Medical professionals use standard deviation to interpret lab results and monitor patient health metrics over time.

How the Standard Deviation Calculator Addresses User Needs

Our Standard Deviation Calculator is designed to address several key user needs and solve specific problems related to data analysis:

1. Time-Saving Efficiency

Manually calculating standard deviation can be time-consuming and prone to errors, especially with large data sets. Our calculator automates this process, allowing users to obtain results instantly, regardless of the data set size.

2. Flexibility in Data Input

The calculator accepts various input formats, accommodating different user preferences and data sources. Whether you’re copying from a spreadsheet or typing numbers manually, the tool adapts to your needs.

3. Accurate Calculations

By implementing precise mathematical formulas, the calculator ensures accurate results every time. This reliability is crucial for making informed decisions based on statistical analysis.

4. Educational Tool

For students and educators, the calculator serves as an excellent learning aid. By providing not only the standard deviation but also the mean and variance, it helps users understand the relationships between these statistical measures.

5. Versatility in Application

The option to choose between population and sample standard deviation makes the calculator versatile for various scenarios, from analyzing entire data sets to making inferences from samples.

6. Clear Result Presentation

Results are displayed clearly, showing the mean, variance, and standard deviation. This comprehensive output helps users gain a fuller understanding of their data’s characteristics.

Practical Applications and Example Calculations

To illustrate the practical applications of our Standard Deviation Calculator, let’s explore some real-world examples:

Example 1: Analyzing Test Scores

A teacher wants to analyze the distribution of test scores in her class. The scores are:

85, 92, 78, 90, 88, 76, 95, 89, 82, 87

Using the calculator:

  1. Enter the data: 85, 92, 78, 90, 88, 76, 95, 89, 82, 87
  2. Select “Sample Standard Deviation” (as this is a sample of student performances)
  3. Click “Calculate”

Results:

  • Mean: 86.2
  • Variance: 39.96
  • Standard Deviation: 6.32

Interpretation: The average score is 86.2, with a standard deviation of 6.32. This means that most scores fall within the range of 79.88 to 92.52 (one standard deviation above and below the mean), indicating a relatively consistent performance across the class.

Example 2: Quality Control in Manufacturing

A manufacturing plant produces bolts with a target diameter of 10 mm. To check consistency, they measure 12 randomly selected bolts:

9.98, 10.02, 10.05, 9.97, 10.01, 10.03, 9.99, 10.04, 10.00, 9.96, 10.02, 10.01

Using the calculator:

  1. Enter the data: 9.98, 10.02, 10.05, 9.97, 10.01, 10.03, 9.99, 10.04, 10.00, 9.96, 10.02, 10.01
  2. Select “Sample Standard Deviation”
  3. Click “Calculate”

Results:

  • Mean: 10.007
  • Variance: 0.000697
  • Standard Deviation: 0.0264

Interpretation: The mean diameter is very close to the target of 10 mm, and the small standard deviation of 0.0264 mm indicates high consistency in production. Most bolts fall within 9.9806 mm to 10.0334 mm, which is likely within acceptable tolerances for this manufacturing process.

Example 3: Analyzing Stock Price Volatility

An investor wants to compare the volatility of two stocks based on their daily closing prices over the past week:

Stock A: 45.2, 46.8, 46.1, 45.9, 47.2

Stock B: 30.5, 32.1, 29.8, 33.2, 31.7

Using the calculator for Stock A:

  1. Enter the data: 45.2, 46.8, 46.1, 45.9, 47.2
  2. Select “Population Standard Deviation” (as we’re considering all data points)
  3. Click “Calculate”

Results for Stock A:

  • Mean: 46.24
  • Variance: 0.5424
  • Standard Deviation: 0.7365

Repeat the process for Stock B:

Results for Stock B:

  • Mean: 31.46
  • Variance: 1.7624
  • Standard Deviation: 1.3276

Interpretation: Stock B has a higher standard deviation (1.3276) compared to Stock A (0.7365), indicating that Stock B is more volatile. This information can help the investor make decisions based on their risk tolerance and investment strategy.

Frequently Asked Questions (FAQ)

Q1: What’s the difference between population and sample standard deviation?

A1: Population standard deviation is used when you have data for an entire population. Sample standard deviation is used when you have a subset of data from a larger population. The sample standard deviation uses (n-1) in the denominator instead of n to account for the uncertainty in estimating the population mean from a sample.

Q2: How do I interpret the standard deviation?

A2: The standard deviation tells you how spread out the data is from the mean. A smaller standard deviation indicates that the data points tend to be close to the mean, while a larger standard deviation indicates they are more spread out. In a normal distribution, approximately 68% of the data falls within one standard deviation of the mean, 95% within two standard deviations, and 99.7% within three standard deviations.

Q3: Can I use this calculator for any type of data?

A3: This calculator is designed for numerical data. It works best with continuous data (like heights, weights, or temperatures) but can also be used for discrete numerical data (like counts or ratings). It’s not suitable for categorical or non-numeric data.

Q4: How many data points do I need to calculate standard deviation?

A4: You need at least two data points to calculate standard deviation. However, for more reliable results, it’s generally recommended to have a larger sample size. The more data points you have, the more accurately the standard deviation will represent the spread of your data.

Q5: Why is my standard deviation zero?

A5: If all your data points are identical, the standard deviation will be zero. This means there’s no variation in your data set. Double-check your input to ensure you’ve entered different values if you’re expecting variation.

Q6: Can standard deviation be negative?

A6: No, standard deviation is always non-negative. It’s the square root of the variance, which is always positive or zero. If you see a negative result, there might be an error in the calculation or input.

Q7: How does standard deviation relate to variance?

A7: Variance is the average of the squared differences from the mean, while standard deviation is the square root of the variance. Standard deviation is often preferred because it’s in the same units as the original data, making it easier to interpret.

Q8: Can I use this calculator for financial data analysis?

A8: Yes, this calculator is suitable for analyzing financial data such as stock prices, returns on investments, or sales figures. In finance, standard deviation is often used as a measure of volatility or risk.

Q9: How accurate is this calculator?

A9: Our calculator uses precise mathematical formulas and is designed to provide accurate results to four decimal places. However, the accuracy of the output depends on the accuracy and appropriateness of the input data.

Q10: Can I use this calculator for comparing different data sets?

A10: Yes, you can use this calculator to compare the variability of different data sets. However, when comparing data sets with different means or units, it’s often more appropriate to use the coefficient of variation (CV), which is the standard deviation divided by the mean.

By addressing these common questions, we hope to provide a comprehensive understanding of standard deviation and how to effectively use our calculator. Whether you’re a student, researcher, or professional, this tool can significantly streamline your data analysis process and provide valuable insights into your data sets.

Important Disclaimer

The calculations, results, and content provided by our tools are not guaranteed to be accurate, complete, or reliable. Users are responsible for verifying and interpreting the results. Our content and tools may contain errors, biases, or inconsistencies. We reserve the right to save inputs and outputs from our tools for the purposes of error debugging, bias identification, and performance improvement. External companies providing AI models used in our tools may also save and process data in accordance with their own policies. By using our tools, you consent to this data collection and processing. We reserve the right to limit the usage of our tools based on current usability factors. By using our tools, you acknowledge that you have read, understood, and agreed to this disclaimer. You accept the inherent risks and limitations associated with the use of our tools and services.
Create Your Own Web Tool for Free