Statistical Calculator
Example: 1 2 3 4 5
Results:
Is this tool helpful?
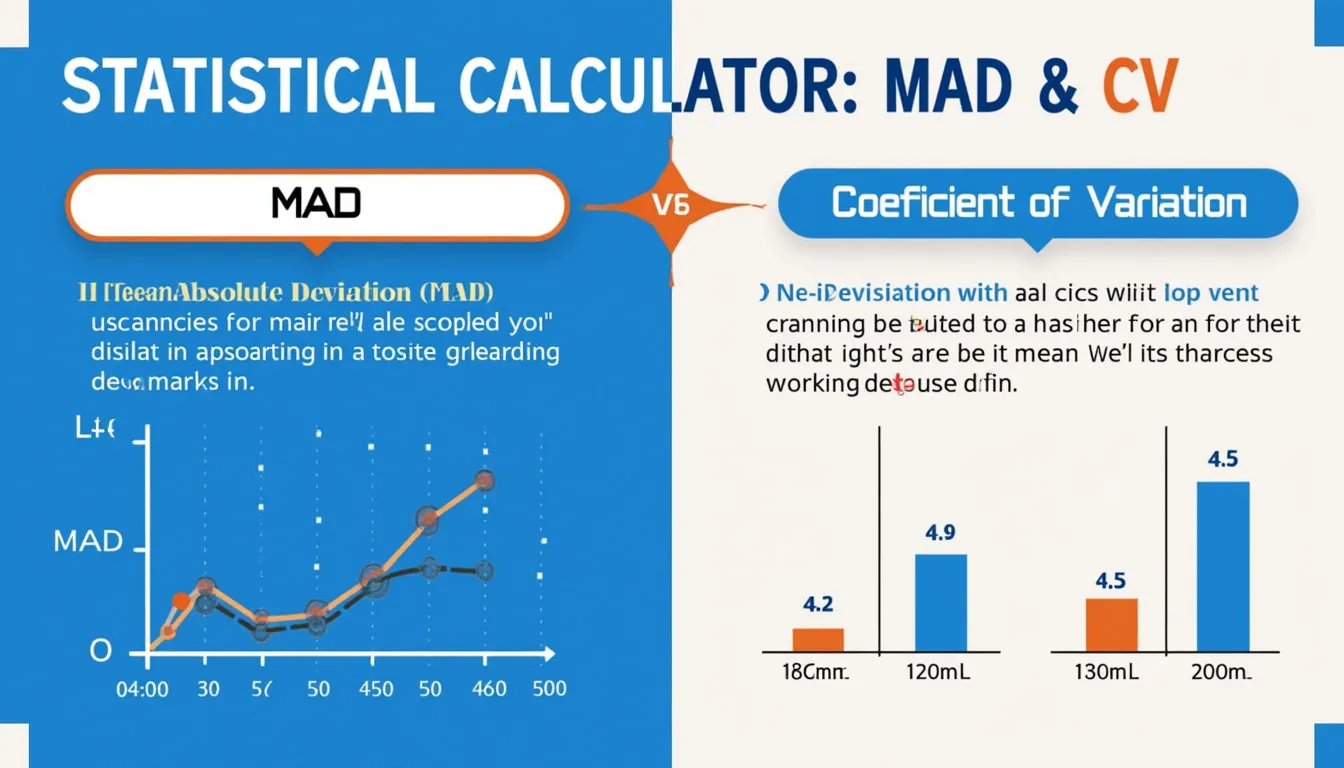
Statistical Calculator: Mean Absolute Deviation and Coefficient of Variation
How to Use the Statistical Calculator Effectively
Our Statistical Calculator is designed to help you quickly compute two important measures of variability: Mean Absolute Deviation (MAD) and Coefficient of Variation (CV). Here’s a step-by-step guide on how to use this tool effectively:
- Enter your observations in the input field labeled “Observations”.
- Separate each number with a space. For example: 1 2 3 4 5
- Click the “Calculate” button to process your data.
- The results will appear below, showing both the Mean Absolute Deviation and Coefficient of Variation.
It’s that simple! Now let’s dive deeper into what these calculations mean and why they’re important in statistical analysis.
Understanding Mean Absolute Deviation (MAD) and Coefficient of Variation (CV)
Mean Absolute Deviation (MAD) and Coefficient of Variation (CV) are two essential statistical measures that provide insights into the variability and dispersion of a dataset. Let’s explore each of these concepts in detail.
Mean Absolute Deviation (MAD)
Mean Absolute Deviation is a measure of variability that calculates the average distance between each data point and the mean of the dataset. It provides a clear picture of how spread out the values are in a dataset.
The formula for calculating MAD is:
$$ MAD = \frac{\sum_{i=1}^{n} |x_i – \bar{x}|}{n} $$Where:
- $$x_i$$ is each value in the dataset
- $$\bar{x}$$ is the mean of the dataset
- $$n$$ is the number of values in the dataset
Coefficient of Variation (CV)
The Coefficient of Variation is a standardized measure of dispersion that allows you to compare the variability of datasets with different units or vastly different means. It expresses the standard deviation as a percentage of the mean.
The formula for calculating CV is:
$$ CV = \frac{\sigma}{\mu} \times 100\% $$Where:
- $$\sigma$$ is the standard deviation of the dataset
- $$\mu$$ is the mean of the dataset
Benefits of Using the Statistical Calculator
Our Statistical Calculator offers numerous advantages for students, researchers, and professionals working with data analysis. Here are some key benefits:
- Time-saving: Quickly compute MAD and CV without manual calculations.
- Accuracy: Eliminate human error in complex mathematical operations.
- Convenience: Access the tool anytime, anywhere with an internet connection.
- User-friendly: Simple interface suitable for users with varying levels of statistical knowledge.
- Data insights: Gain valuable information about your dataset’s variability and dispersion.
- Comparative analysis: Use CV to compare datasets with different units or means.
Addressing User Needs and Solving Specific Problems
Our Statistical Calculator is designed to address various user needs and solve specific problems related to data analysis. Here’s how it can help in different scenarios:
1. Understanding Data Variability
Mean Absolute Deviation (MAD) provides a clear measure of how spread out the values are in a dataset. This is particularly useful when you need to:
- Assess the consistency of measurements or observations
- Identify potential outliers or unusual data points
- Compare the variability of different datasets
For example, if you’re analyzing test scores from different classes, MAD can help you determine which class has more consistent performance.
2. Comparing Datasets with Different Units or Means
The Coefficient of Variation (CV) is particularly useful when you need to compare the variability of datasets that have different units or vastly different means. This is valuable in situations such as:
- Comparing the volatility of different stocks
- Assessing the reliability of measurement techniques
- Evaluating the consistency of manufacturing processes
For instance, if you’re comparing the variability of heights (measured in centimeters) and weights (measured in kilograms) in a population, CV allows for a meaningful comparison despite the different units.
3. Quick Data Analysis for Decision Making
In many professional settings, quick data analysis is crucial for informed decision-making. Our calculator allows you to:
- Rapidly assess data variability in real-time scenarios
- Make on-the-spot comparisons between different datasets
- Provide quantitative backing for qualitative observations
This can be particularly useful in fields like quality control, financial analysis, or scientific research where quick, data-driven decisions are essential.
Practical Applications and Examples
To illustrate the practical applications of our Statistical Calculator, let’s consider some real-world examples:
Example 1: Analyzing Student Test Scores
Suppose you’re a teacher with two classes, and you want to compare their performance on a recent test. Here are the scores:
Class A: 75, 82, 78, 80, 85, 79, 81, 76, 83, 77
Class B: 65, 90, 72, 88, 79, 85, 68, 92, 75, 86
Using our calculator, you can find:
- Class A: MAD ≈ 2.56, CV ≈ 3.97%
- Class B: MAD ≈ 8.64, CV ≈ 11.76%
Interpretation: Class A has a lower MAD and CV, indicating more consistent performance across students. Class B shows higher variability, suggesting a wider range of student abilities or understanding.
Example 2: Comparing Stock Volatility
Let’s say you’re an investor comparing the volatility of two stocks over the past 5 days. Here are the closing prices:
Stock X: $50, $52, $49, $51, $53
Stock Y: $150, $158, $145, $152, $155
Using our calculator:
- Stock X: MAD ≈ 1.28, CV ≈ 3.14%
- Stock Y: MAD ≈ 4.08, CV ≈ 3.31%
Interpretation: While Stock Y has a higher MAD due to its higher price, the CV shows that both stocks have similar relative volatility. This demonstrates the value of CV in comparing datasets with different scales.
Example 3: Quality Control in Manufacturing
Imagine you’re a quality control manager in a factory that produces bolts. You’re comparing the consistency of two production lines by measuring the length of 10 bolts from each line (in millimeters):
Line A: 49.8, 50.1, 50.0, 49.9, 50.2, 50.1, 49.9, 50.0, 50.1, 49.9
Line B: 49.5, 50.3, 49.8, 50.2, 49.9, 50.1, 50.0, 49.7, 50.4, 50.1
Using our calculator:
- Line A: MAD ≈ 0.1, CV ≈ 0.24%
- Line B: MAD ≈ 0.24, CV ≈ 0.58%
Interpretation: Line A shows lower MAD and CV, indicating more consistent production. Line B has higher variability, which might warrant investigation into the production process for potential improvements.
Frequently Asked Questions (FAQ)
1. What is the difference between MAD and Standard Deviation?
Both MAD and Standard Deviation measure variability in a dataset. MAD uses the average absolute deviation from the mean, while Standard Deviation uses squared deviations. MAD is often considered more robust to outliers and easier to interpret, while Standard Deviation is more commonly used in further statistical analyses.
2. When should I use CV instead of MAD?
Use CV when you want to compare the variability of datasets with different units or vastly different means. MAD is more suitable for understanding the absolute spread of data within a single dataset.
3. Can I use this calculator for large datasets?
Yes, our calculator can handle large datasets. However, for very large datasets (thousands of data points), you might experience a slight delay in calculation time.
4. How do I interpret the results?
For MAD, a lower value indicates less variability in the dataset. For CV, a lower percentage indicates less relative variability. Generally, a CV of less than 1 is considered low, 1-5 moderate, and above 5 high, but this can vary depending on the field of study.
5. Can I use negative numbers in my dataset?
Yes, our calculator can handle negative numbers. However, be cautious when interpreting CV for datasets with both positive and negative values or a mean close to zero, as the results may be misleading.
6. Is this calculator suitable for all types of data?
This calculator is designed for numerical data. It’s not suitable for categorical or ordinal data. For time series or paired data, additional considerations may be necessary when interpreting the results.
Please note that while we strive for accuracy, we cannot guarantee that the webtool or results from our webtool are always correct, complete, or reliable. Our content and tools might have mistakes, biases, or inconsistencies. Always cross-check important calculations and consult with a qualified professional when necessary.
Conclusion: Empowering Your Data Analysis
Our Statistical Calculator for Mean Absolute Deviation and Coefficient of Variation is a powerful tool designed to enhance your data analysis capabilities. By providing quick and accurate calculations of these important statistical measures, it empowers you to:
- Gain deeper insights into data variability
- Make meaningful comparisons between different datasets
- Support decision-making processes with quantitative evidence
- Save time and reduce the risk of calculation errors
Whether you’re a student learning about statistical concepts, a researcher analyzing experimental data, or a professional making data-driven decisions, this tool can significantly streamline your workflow and enhance your understanding of data variability.
We encourage you to explore the full potential of this calculator by applying it to your own datasets. Remember, understanding variability is key to making informed interpretations and decisions based on your data.
Start using our Statistical Calculator today and take your data analysis to the next level!
Important Disclaimer
The calculations, results, and content provided by our tools are not guaranteed to be accurate, complete, or reliable. Users are responsible for verifying and interpreting the results. Our content and tools may contain errors, biases, or inconsistencies. We reserve the right to save inputs and outputs from our tools for the purposes of error debugging, bias identification, and performance improvement. External companies providing AI models used in our tools may also save and process data in accordance with their own policies. By using our tools, you consent to this data collection and processing. We reserve the right to limit the usage of our tools based on current usability factors. By using our tools, you acknowledge that you have read, understood, and agreed to this disclaimer. You accept the inherent risks and limitations associated with the use of our tools and services.