T-Test Calculator: Analyze Statistical Significance with Ease

Unlock the power of statistical analysis with our user-friendly T-Test Calculator. Simplify complex calculations, compare means effortlessly, and make data-driven decisions with confidence. Perfect for researchers, students, and professionals across various fields. Discover how this versatile tool can revolutionize your approach to hypothesis testing and statistical inference. Ready to elevate your research?

T-Test Calculator

Enter comma-separated values or summary statistics based on the selected input method.

Enter the population mean to test against (for one-sample t-test).

Default is 0.05 if left blank.

How to Use the T-Test Calculator Effectively

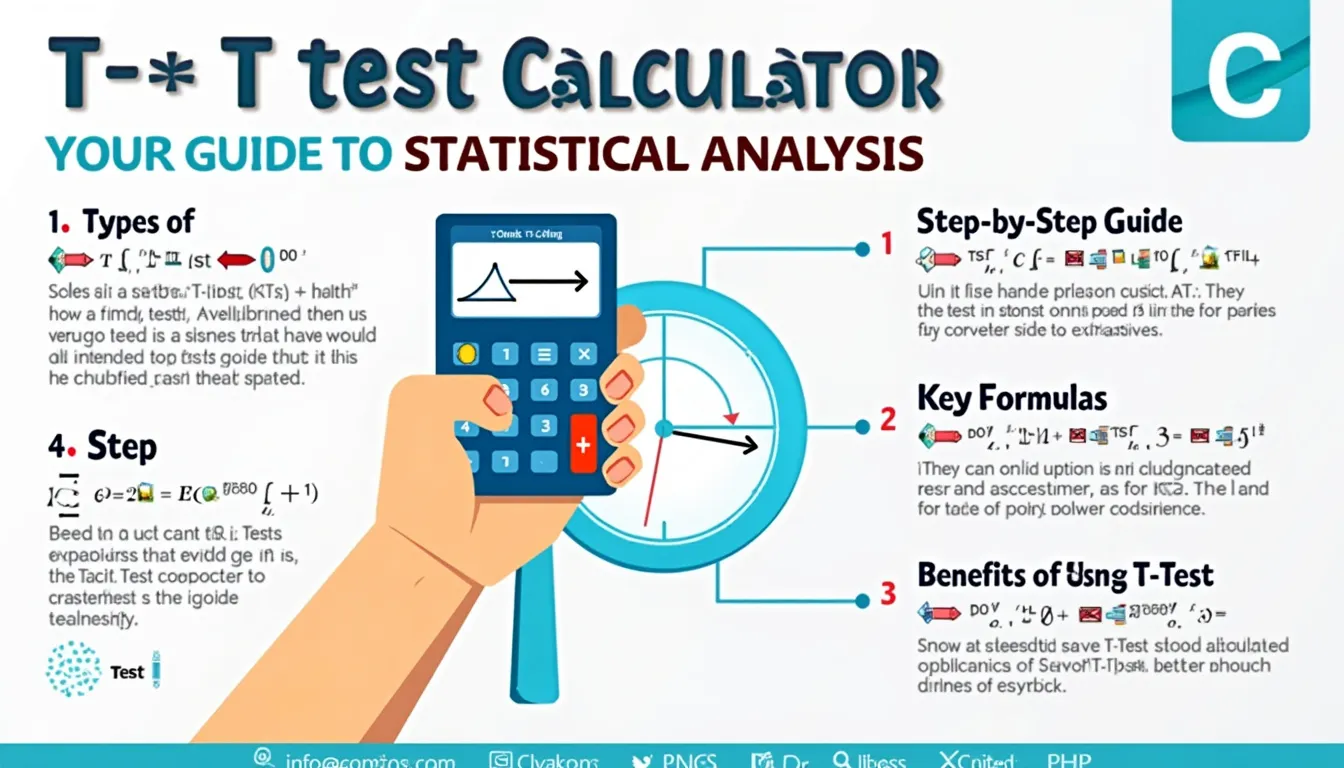
Step-by-Step Guide

Our T-Test Calculator is designed to be user-friendly and intuitive. Follow these steps to perform your statistical analysis:

  1. Select Test Type: Choose from One-Sample t-test, Independent Two-Sample t-test, or Paired Sample t-test.
  2. Choose Data Input Method: Opt for either “Summary Statistics” or “Raw Data” input.
  3. Enter Sample Data: Input your data based on the selected method:
    • For Summary Statistics: Enter mean, standard deviation, and sample size (e.g., 5.2, 1.1, 30)
    • For Raw Data: Enter comma-separated values (e.g., 1.5, 2.3, 3.7, 4.2, 5.1)
  4. Provide Additional Parameters:
    • Hypothesized Population Mean (μ₀): For one-sample tests (e.g., 3.5)
    • Significance Level (α): Default is 0.05 if left blank
    • Tail Type: Two-tailed, Left-tailed, or Right-tailed
  5. Calculate: Click the “Calculate” button to process your inputs.
  6. Interpret Results: Review the calculated t-value, degrees of freedom, p-value, confidence interval, and conclusion.

Understanding T-Tests: Your Gateway to Statistical Inference

T-tests are powerful statistical tools used to compare means and determine if there are significant differences between groups or samples. Our T-Test Calculator simplifies this complex process, making it accessible to students, researchers, and professionals across various fields.

The Purpose and Benefits of T-Tests

T-tests serve several crucial purposes in statistical analysis:

  • Comparing sample means to population means
  • Assessing differences between two independent groups
  • Evaluating changes in paired observations
  • Testing hypotheses about population parameters
  • Providing confidence intervals for mean differences

By using our T-Test Calculator, you gain access to these benefits while avoiding the complexities of manual calculations.

The Power of Our T-Test Calculator

Streamlining Statistical Analysis

Our calculator addresses common challenges in statistical testing:

  • Time-saving: Instantly perform calculations that would take hours manually.
  • Error reduction: Minimize the risk of computational mistakes.
  • Accessibility: No need for specialized statistical software.
  • Flexibility: Handle various t-test types with ease.
  • Visual representation: Gain insights through graphical outputs.

Mathematical Foundation

The T-Test Calculator utilizes robust statistical formulas to ensure accurate results. Here are the key formulas for each test type:

One-Sample T-Test
$$t = \frac{\bar{x} – \mu_0}{s / \sqrt{n}}$$

Where:

  • $$\bar{x}$$ is the sample mean
  • $$\mu_0$$ is the hypothesized population mean
  • $$s$$ is the sample standard deviation
  • $$n$$ is the sample size
Independent Two-Sample T-Test (Equal Variances)
$$t = \frac{\bar{x}_1 – \bar{x}_2}{s_p \sqrt{\frac{1}{n_1} + \frac{1}{n_2}}}$$

Where:

  • $$\bar{x}_1$$ and $$\bar{x}_2$$ are the sample means
  • $$s_p$$ is the pooled standard deviation
  • $$n_1$$ and $$n_2$$ are the sample sizes
Paired Sample T-Test
$$t = \frac{\bar{d}}{s_d / \sqrt{n}}$$

Where:

  • $$\bar{d}$$ is the mean difference between paired observations
  • $$s_d$$ is the standard deviation of the differences
  • $$n$$ is the number of pairs

Practical Applications of T-Tests

Real-World Scenarios

T-tests find applications across various fields:

  • Medicine: Comparing treatment effects in clinical trials
  • Psychology: Assessing the impact of interventions on behavior
  • Education: Evaluating the effectiveness of teaching methods
  • Business: Analyzing customer satisfaction before and after changes
  • Agriculture: Comparing crop yields under different conditions

Example: Educational Research

Let’s consider a scenario where a school wants to evaluate the effectiveness of a new teaching method on student performance.

Scenario Details:
  • Test Type: Independent Two-Sample T-Test
  • Group 1 (Traditional Method): Mean score = 75, Standard deviation = 8, Sample size = 30
  • Group 2 (New Method): Mean score = 80, Standard deviation = 7, Sample size = 35
  • Significance Level: 0.05
  • Tail Type: Two-tailed
Using the Calculator:
  1. Select “Independent Two-Sample t-test” as the Test Type
  2. Choose “Summary Statistics” as the Data Input Method
  3. Enter Group 1 data: 75, 8, 30
  4. Enter Group 2 data: 80, 7, 35
  5. Set Significance Level to 0.05
  6. Select “Two-tailed” as the Tail Type
  7. Click “Calculate”
Interpreting the Results:

The calculator would provide:

  • T-value: approximately 2.67
  • Degrees of freedom: 63
  • P-value: approximately 0.0096
  • 95% Confidence Interval: [-8.71, -1.29]
  • Conclusion: Reject the null hypothesis

These results suggest that there is a statistically significant difference between the two teaching methods, with the new method appearing to be more effective.

Benefits of Using Our T-Test Calculator

Empowering Decision-Making

Our T-Test Calculator offers numerous advantages:

  • Precision: Obtain accurate results without manual calculation errors.
  • Efficiency: Save time and resources in data analysis.
  • Accessibility: Perform complex statistical tests without specialized software.
  • Educational value: Learn and understand t-tests through hands-on experience.
  • Versatility: Suitable for various test types and data input methods.
  • Visual insights: Gain a deeper understanding through graphical representations.
  • Confidence building: Make data-driven decisions with statistical backing.

Enhancing Research Quality

By using our calculator, researchers can:

  • Increase the reliability of their statistical analyses
  • Standardize their approach to hypothesis testing
  • Easily replicate and verify results
  • Focus more on interpretation and less on computation
  • Collaborate more effectively by sharing consistent methodologies

Addressing User Needs and Solving Problems

Overcoming Statistical Challenges

Our T-Test Calculator addresses several common issues faced by users:

  • Complexity of formulas: Eliminates the need to memorize or look up complex statistical formulas.
  • Calculation errors: Reduces the risk of mistakes in manual computations.
  • Time constraints: Provides instant results, allowing for quick decision-making.
  • Limited statistical knowledge: Guides users through the process with clear input requirements.
  • Interpretation difficulties: Offers clear conclusions and visual representations to aid understanding.

Example: Medical Research

Consider a medical researcher comparing the effectiveness of two drugs in reducing blood pressure.

Scenario:
  • Test Type: Paired Sample T-Test
  • Sample Size: 20 patients
  • Data: Blood pressure differences (Drug A – Drug B) in mmHg
  • Raw Data: -5, -3, -8, -2, -1, -4, -6, -3, -7, -5, -2, -4, -6, -8, -1, -3, -5, -4, -2, -6
  • Significance Level: 0.01
  • Tail Type: Left-tailed (to test if Drug A is more effective in lowering blood pressure)
Using the Calculator:
  1. Select “Paired Sample t-test” as the Test Type
  2. Choose “Raw Data” as the Data Input Method
  3. Enter the differences: -5, -3, -8, -2, -1, -4, -6, -3, -7, -5, -2, -4, -6, -8, -1, -3, -5, -4, -2, -6
  4. Set Significance Level to 0.01
  5. Select “Left-tailed” as the Tail Type
  6. Click “Calculate”
Results and Interpretation:

The calculator would provide:

  • T-value: approximately -9.798
  • Degrees of freedom: 19
  • P-value: approximately 1.92 × 10^-9
  • 99% Confidence Interval: (-∞, -3.37)
  • Conclusion: Reject the null hypothesis

These results strongly suggest that Drug A is significantly more effective than Drug B in lowering blood pressure, as the p-value is well below the 0.01 significance level.

Frequently Asked Questions (FAQ)

1. What is a t-test, and when should I use it?

A t-test is a statistical method used to determine if there is a significant difference between the means of two groups or between a sample mean and a known population mean. You should use a t-test when you want to compare means and have relatively small sample sizes (typically less than 30).

2. How do I choose between a one-tailed and two-tailed test?

Choose a one-tailed test when you have a specific directional hypothesis (e.g., Group A will perform better than Group B). Use a two-tailed test when you’re interested in any difference between groups, regardless of direction.

3. What does the p-value tell me?

The p-value represents the probability of obtaining results at least as extreme as the observed results, assuming the null hypothesis is true. A small p-value (typically less than 0.05) suggests strong evidence against the null hypothesis, indicating a statistically significant result.

4. How do I interpret the confidence interval?

The confidence interval provides a range of plausible values for the true population parameter. For example, a 95% confidence interval means that if you repeated the sampling process many times, about 95% of the intervals would contain the true population parameter.

5. Can I use this calculator for large sample sizes?

Yes, you can use this calculator for large sample sizes. However, for very large samples (typically over 30), the t-distribution closely approximates the normal distribution, and you might consider using a z-test instead.

6. What’s the difference between a t-test and a z-test?

T-tests are typically used for smaller sample sizes and when the population standard deviation is unknown. Z-tests are used for larger sample sizes or when the population standard deviation is known. T-tests use the t-distribution, while z-tests use the normal distribution.

7. How do I know if my data meets the assumptions for a t-test?

The main assumptions for t-tests are:

  • The data is approximately normally distributed
  • The samples are independent (for independent t-tests)
  • The variances of the two groups are approximately equal (for independent t-tests with equal variances assumed)
You can check these assumptions using graphical methods (like Q-Q plots) or statistical tests (like the Shapiro-Wilk test for normality).

8. What should I do if my data doesn’t meet the t-test assumptions?

If your data violates t-test assumptions, you might consider:

  • Transforming your data to achieve normality
  • Using non-parametric tests (e.g., Mann-Whitney U test instead of independent t-test)
  • Using robust statistical methods that are less sensitive to violations of assumptions

9. Can this calculator handle unequal sample sizes?

Yes, our calculator can handle unequal sample sizes for independent two-sample t-tests. It automatically adjusts the calculations to account for the difference in sample sizes.

10. How do I report t-test results in a research paper?

When reporting t-test results, typically include:

  • The t-value
  • Degrees of freedom
  • P-value
  • Mean difference and confidence interval
  • Effect size (e.g., Cohen’s d)
For example: “The new teaching method (M = 80, SD = 7) showed significantly higher scores than the traditional method (M = 75, SD = 8), t(63) = 2.67, p = .0096, 95% CI [-8.71, -1.29], d = 0.66.”

Conclusion: Empowering Statistical Analysis

Our T-Test Calculator is a powerful tool designed to simplify complex statistical analyses, making them accessible to researchers, students, and professionals across various fields. By providing accurate calculations, clear interpretations, and visual representations, it empowers users to make data-driven decisions with confidence.

Whether you’re comparing treatment effects in medical research, evaluating teaching methods in education, or analyzing customer satisfaction in business, this calculator offers the flexibility and precision needed for robust statistical inference. Its user-friendly interface, coupled with the ability to handle various t-test types and data input methods, makes it an invaluable resource for anyone engaged in quantitative research or analysis.

By leveraging the power of this T-Test Calculator, you can save time, reduce errors, and focus on interpreting results rather than getting bogged down in complex calculations. This not only enhances the quality of your research but also accelerates the pace of discovery and innovation in your field.

Embrace the power of statistical analysis with our T-Test Calculator, and take your research and decision-making to the next level. Whether you’re a seasoned statistician or new to the world of data analysis, this tool is your gateway to unlocking valuable insights from your data.

Important Disclaimer

The calculations, results, and content provided by our tools are not guaranteed to be accurate, complete, or reliable. Users are responsible for verifying and interpreting the results. Our content and tools may contain errors, biases, or inconsistencies. We reserve the right to save inputs and outputs from our tools for the purposes of error debugging, bias identification, and performance improvement. External companies providing AI models used in our tools may also save and process data in accordance with their own policies. By using our tools, you consent to this data collection and processing. We reserve the right to limit the usage of our tools based on current usability factors. By using our tools, you acknowledge that you have read, understood, and agreed to this disclaimer. You accept the inherent risks and limitations associated with the use of our tools and services.
Create Your Own Web Tool for Free