Data analysis is a crucial process for examining and interpreting data sets to uncover valuable insights and support decision-making. Our comprehensive suite of data analysis tools empowers businesses and professionals to perform in-depth statistical calculations with ease. From computing weighted averages for prioritized data to analyzing data distribution with quartiles, our calculators offer precise and efficient solutions. Users can leverage our variance calculator for measuring data spread and utilize the binomial distribution calculator for probability assessments. These powerful tools enable organizations to extract meaningful patterns, trends, and probabilities from their data, leading to more informed strategies and improved outcomes. Explore our data analysis category to enhance your analytical capabilities and drive data-driven success in your business.
Transform complex data into compelling, audience-friendly presentations with our Data Presenter tool. Analyze trends, create impactful visualizations, and communicate insights effectively across various data types and audience levels.
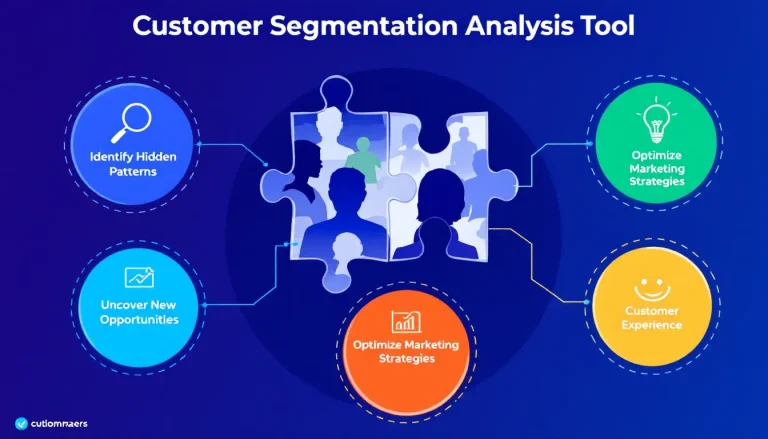
Our Customer Segmentation Analysis Tool empowers marketers to dissect complex customer data, revealing crucial insights for targeted marketing strategies. By identifying distinct patterns in customer behavior, preferences, and demographics, this tool facilitates the creation of more effective, personalized marketing campaigns.
Streamline your Excel workflow with our Excel Command Generator. Quickly create accurate formulas for common spreadsheet actions like sum, average, count, max, and min. Perfect for both beginners and experienced users looking to save time on repetitive tasks.
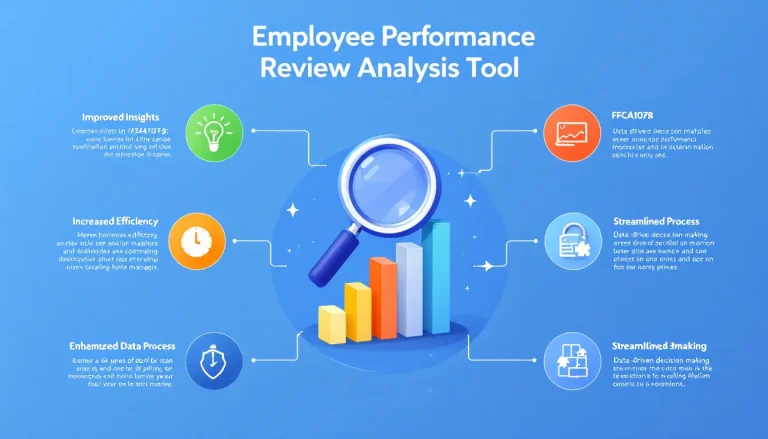
Enhance your organization's performance review process with our powerful benchmarking analysis tool. Compare employee feedback across departments, identify trends, and generate data-driven insights to improve employee satisfaction and overall performance.
Unlock the power of Excel with our Function Guide Generator. Input your desired function and task, and receive a tailored, step-by-step guide complete with examples and optimization tips. Perfect for both beginners and advanced users looking to enhance their spreadsheet skills.
Our Custom Dataset Generator tool allows you to create comprehensive mock datasets with user-specified columns and entries. Ideal for data analysis, machine learning projects, and statistical testing, this tool generates realistic data that simulates real-world scenarios, supporting a wide range of analytical and visualization needs.
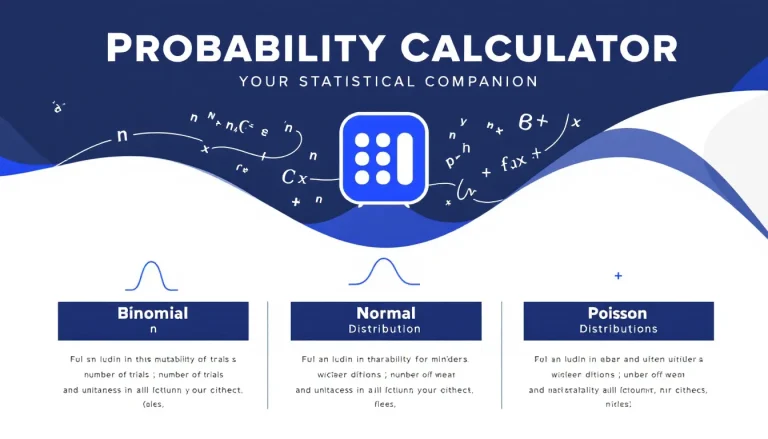
Our comprehensive probability calculator allows you to easily compute and visualize probabilities for binomial, normal, and Poisson distributions. Perfect for students, researchers, and professionals working with statistical data.
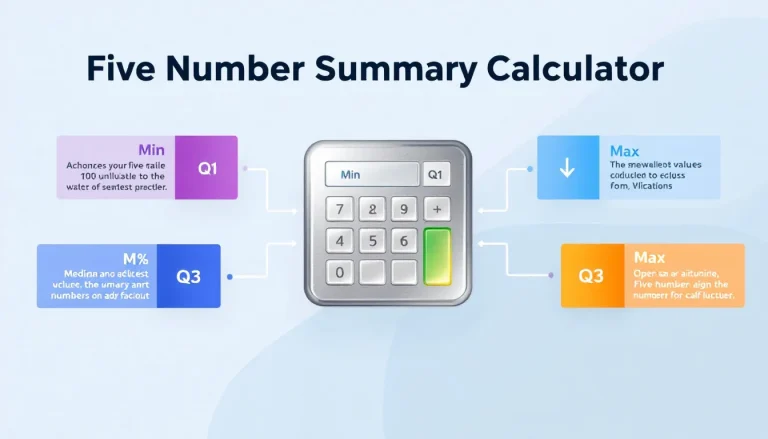
Our Five Number Summary Calculator provides a quick way to analyze data distribution. Enter your dataset, choose a quartile calculation method, and instantly get the minimum, Q1, median, Q3, maximum, IQR, and mean. Visualize results with an optional box plot.
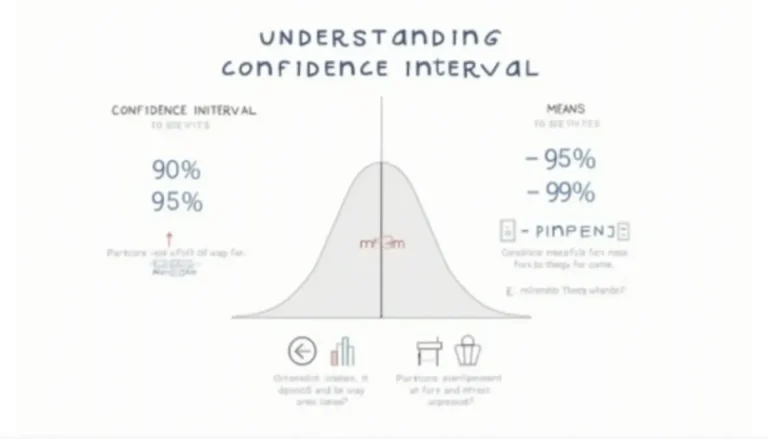
Unlock the power of statistical analysis with our Confidence Interval Calculator. Discover how to estimate population parameters, compare groups, and make data-driven decisions with precision. From market research to medical studies, learn how confidence intervals can revolutionize your approach to data interpretation. Ready to elevate your statistical prowess? Dive in now!