Data visualization is a powerful technique for transforming complex information into clear, easily understandable graphical representations. This category offers a range of tools and resources to help businesses and professionals create compelling visual narratives from their data. From weighted average calculators for precise data analysis to quartile calculators for distribution insights, these tools enable users to uncover patterns, trends, and relationships within their datasets. Data visualization empowers decision-makers by presenting information in a visually appealing and accessible format, facilitating better understanding and more informed choices. Whether you’re analyzing financial data, market trends, or performance metrics, our data visualization tools can help you communicate your findings effectively and drive meaningful action. Explore our range of visualization options to unlock the full potential of your data and gain a competitive edge in your industry.
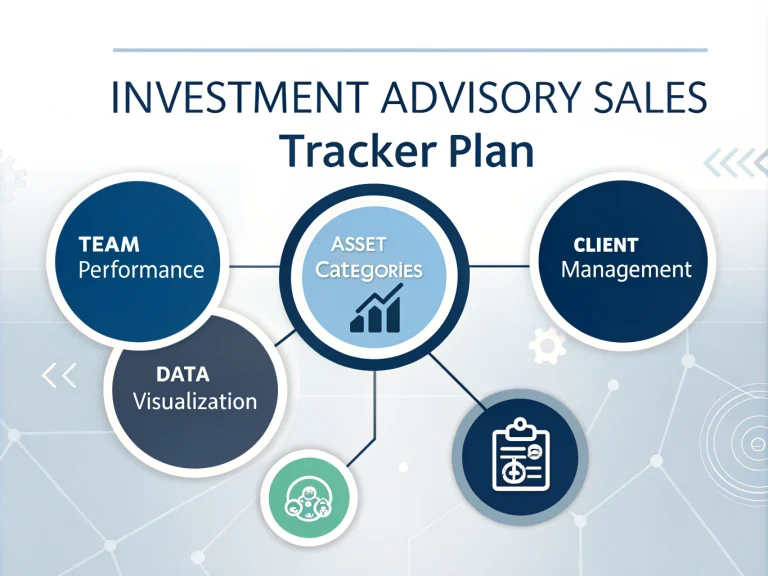
Develop a comprehensive sales tracker for investment advisory teams focusing on financial assets. Monitor sales performance, team efficiency, and client management while utilizing data visualization for improved decision-making.
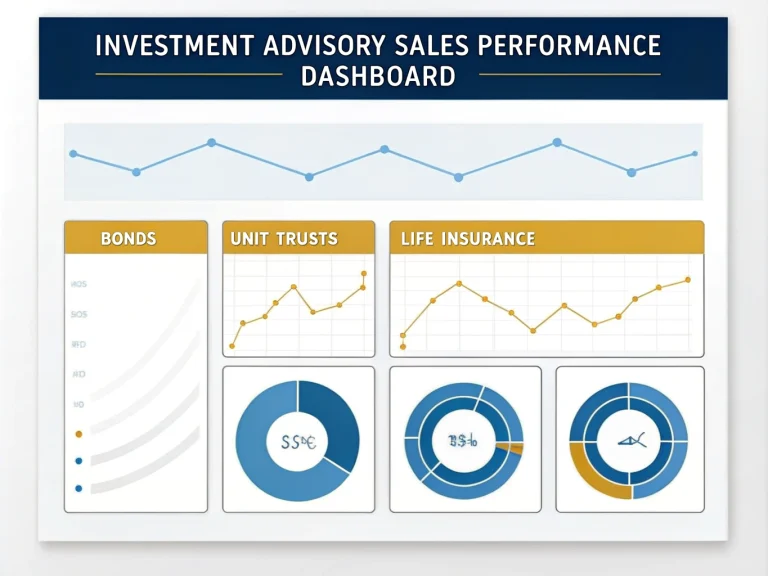
Design tailored sales performance reports for your investment advisory firm. Track bonds, unit trusts, and life insurance sales, compare actual vs. target figures, and visualize individual agent progress with customizable charts and metrics.
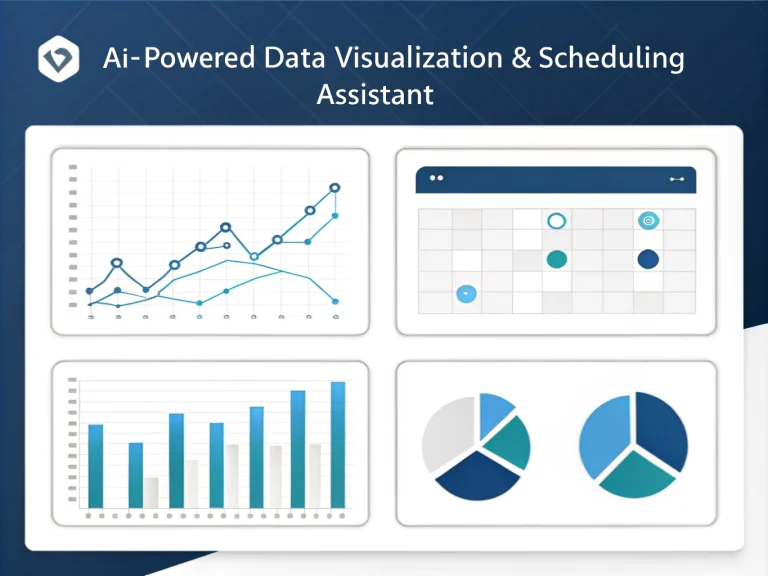
Discover our powerful AI tool that combines data visualization and appointment scheduling capabilities. Create custom charts, manage appointments, and boost your productivity with ease.
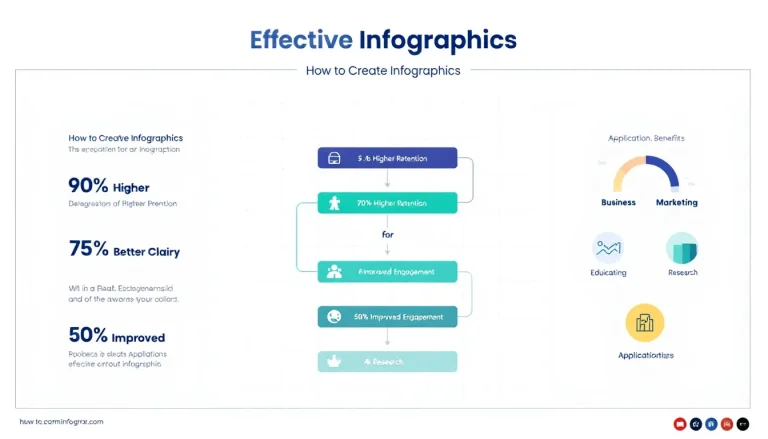
Transform complex information into engaging visual stories with our infographic generator. Create professional, customized infographics tailored to your specific topic, audience, and style preferences. Perfect for presentations, social media, educational materials, and marketing campaigns.
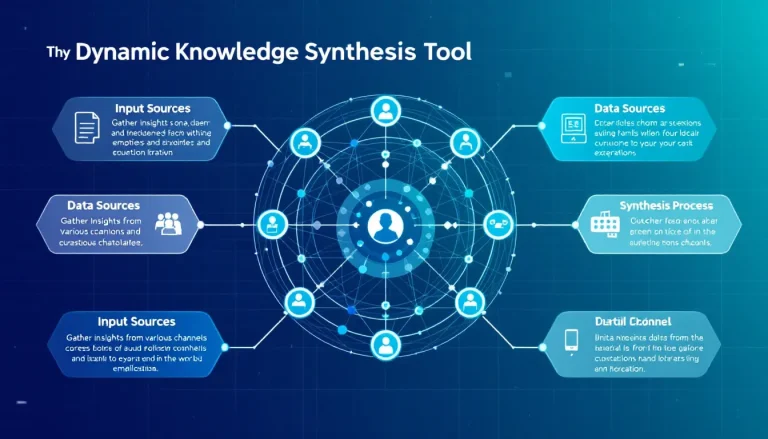
Our Dynamic Knowledge Synthesis Tool empowers organizations to systematically analyze and integrate diverse perspectives, creating comprehensive understanding through iterative cycles. Perfect for policy makers, educators, and market analysts seeking to transform complex information into actionable insights with customizable visualization options.
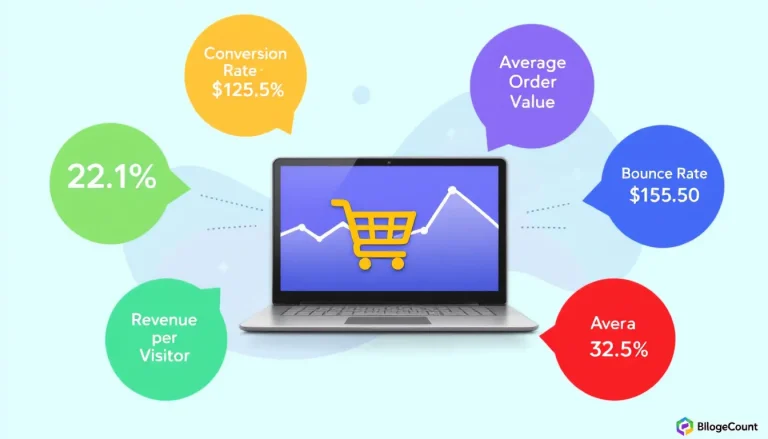
Unlock the power of e-commerce data analysis with our comprehensive tool. Track customer behavior, identify trends, and generate actionable insights to boost sales and improve your online store's performance.
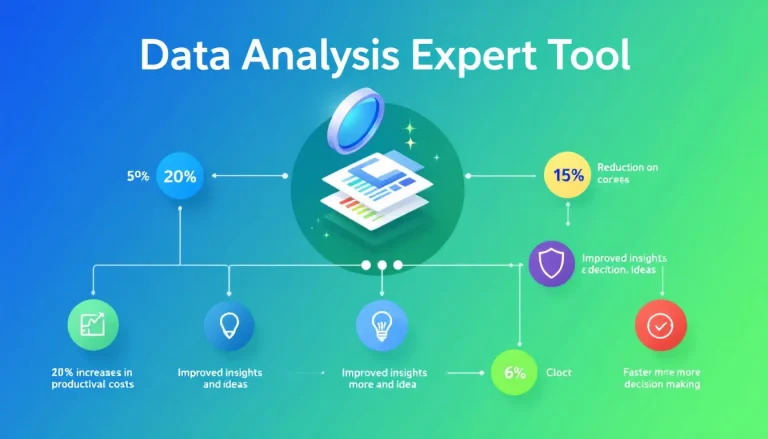
Our Data Analysis Expert Tool empowers you to extract valuable insights from your data, identify key trends and patterns, and receive data-driven recommendations to achieve your desired outcomes. Input your goals and data description, and let our tool guide you towards actionable results.
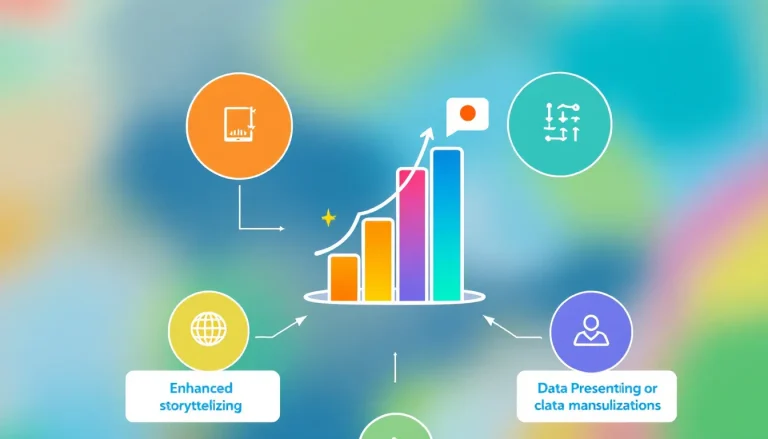
Transform complex data into compelling, audience-friendly presentations with our Data Presenter tool. Analyze trends, create impactful visualizations, and communicate insights effectively across various data types and audience levels.
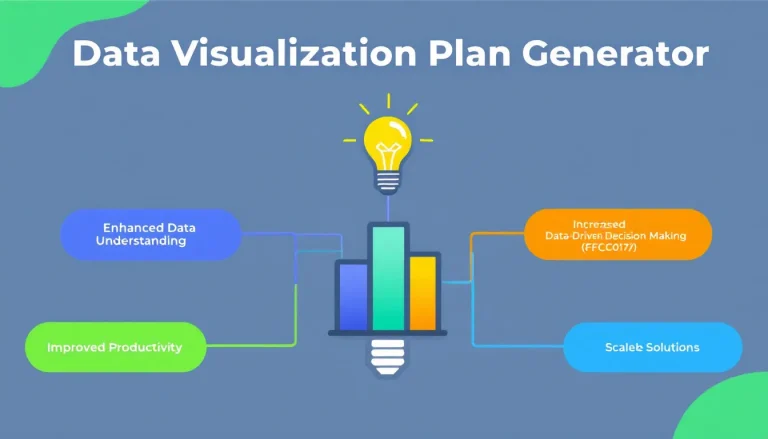
Unlock the power of your data with our Data Visualization Expert tool. Transform complex information into clear, compelling visuals that drive strategic decision-making and help achieve your specific business goals. Ideal for professionals looking to create impactful data stories and actionable insights.