Data visualization is a powerful technique for transforming complex information into clear, easily understandable graphical representations. This category offers a range of tools and resources to help businesses and professionals create compelling visual narratives from their data. From weighted average calculators for precise data analysis to quartile calculators for distribution insights, these tools enable users to uncover patterns, trends, and relationships within their datasets. Data visualization empowers decision-makers by presenting information in a visually appealing and accessible format, facilitating better understanding and more informed choices. Whether you’re analyzing financial data, market trends, or performance metrics, our data visualization tools can help you communicate your findings effectively and drive meaningful action. Explore our range of visualization options to unlock the full potential of your data and gain a competitive edge in your industry.
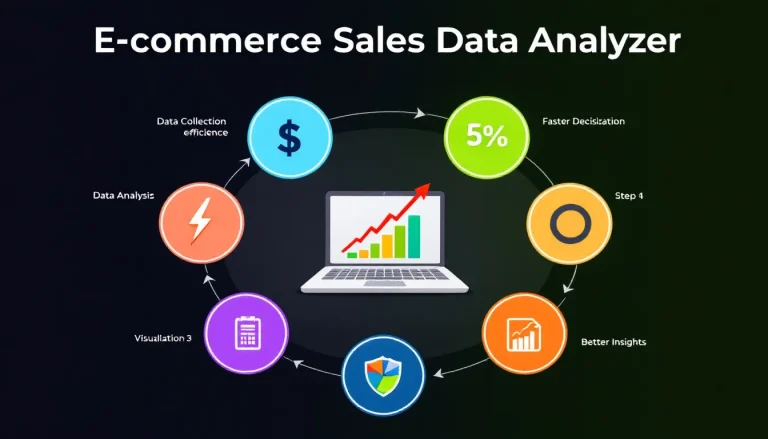
Harness the power of data-driven decision-making with our E-commerce Sales Data Analyzer. This tool helps you identify key trends, optimize conversion rates, and gain valuable insights into customer behavior and product performance. Elevate your online store's success with actionable recommendations based on in-depth analysis.
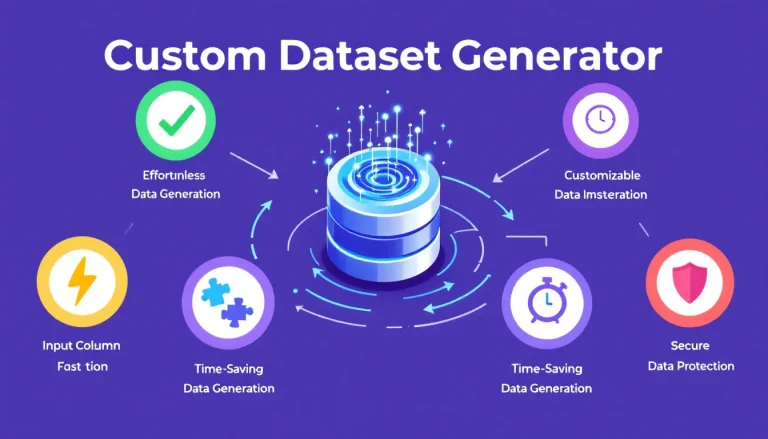
Our Custom Dataset Generator tool allows you to create comprehensive mock datasets with user-specified columns and entries. Ideal for data analysis, machine learning projects, and statistical testing, this tool generates realistic data that simulates real-world scenarios, supporting a wide range of analytical and visualization needs.
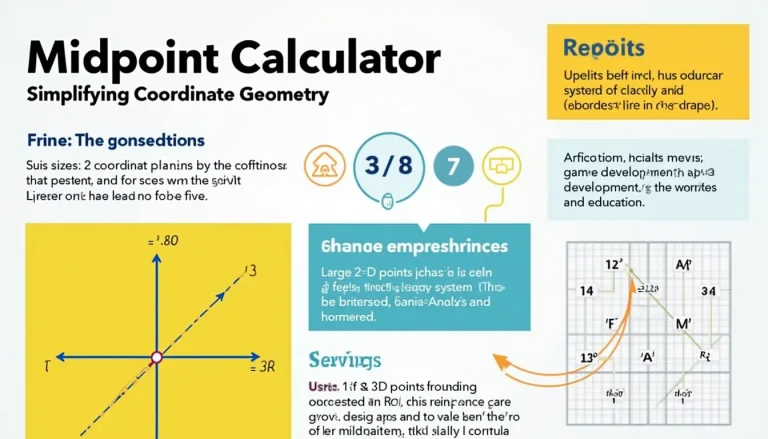
Unlock the power of precise geometric calculations with our Midpoint Calculator. Whether you're a student, architect, or game developer, this versatile tool simplifies 2D and 3D midpoint finding. Discover how it enhances accuracy, saves time, and visualizes results. Ready to revolutionize your spatial problem-solving? Explore the Midpoint Calculator now!
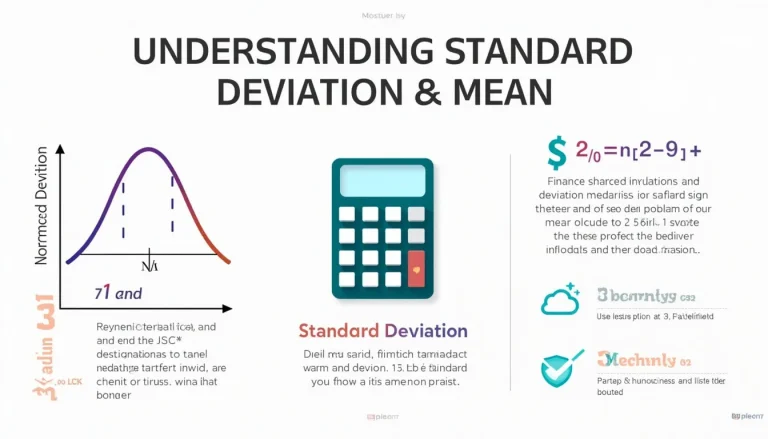
Unlock the power of data analysis with our Standard Deviation and Mean Calculator. From finance to education, discover how this versatile tool simplifies complex calculations and provides instant insights. Learn to interpret results like a pro and make informed decisions. Ready to elevate your statistical prowess? Dive in now!
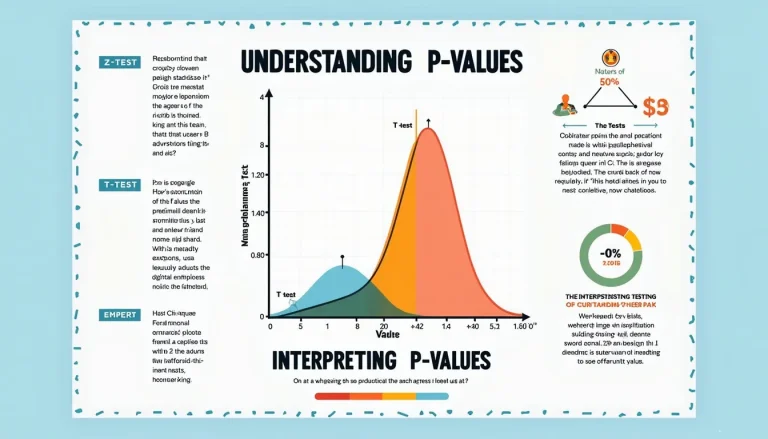
Unlock the power of statistical analysis with our P-Value Calculator. From Z-tests to Chi-Square, this versatile tool simplifies hypothesis testing across disciplines. Boost your research accuracy, save time, and make data-driven decisions with confidence. Discover how p-values can transform your analytical approach today!
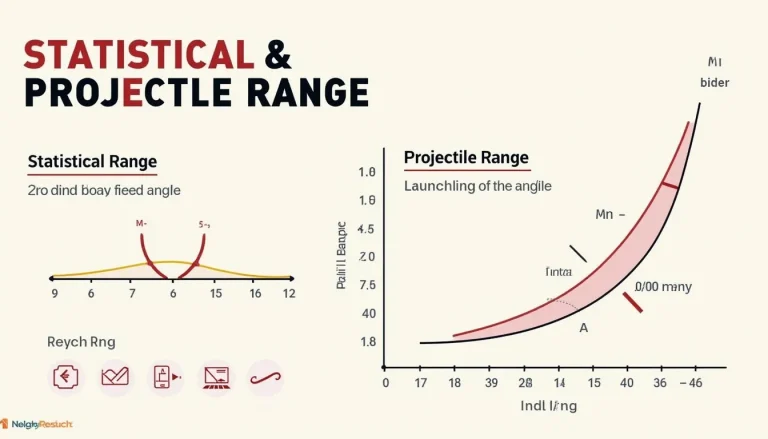
Unlock the power of range calculations with our versatile tool! From statistical analysis to projectile motion, discover how this calculator can revolutionize your data interpretation and physics problem-solving. Dive into real-world applications across various fields and enhance your understanding of range concepts. Ready to explore? Click to learn more!
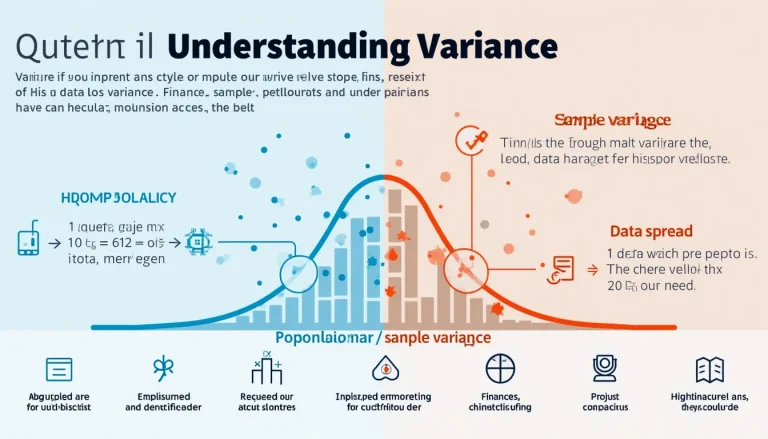
Unlock the power of data analysis with our intuitive Variance Calculator. From research to finance, discover how measuring data spread can revolutionize your decision-making process. Learn to calculate population and sample variance effortlessly, visualize your data, and gain valuable insights. Ready to harness the potential of variance? Explore now!
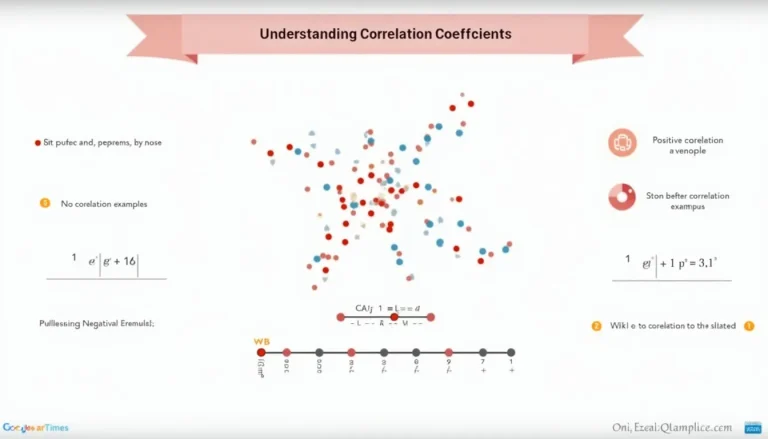
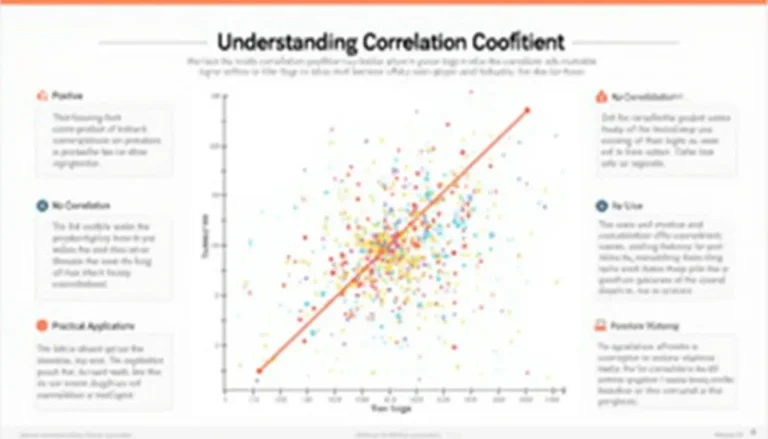
Unlock the power of data analysis with our Correlation Coefficient Calculator. Discover how to interpret relationships between variables, visualize trends, and make informed decisions. From economics to medical research, this tool simplifies complex calculations. Ready to dive deeper into your data? Learn how to leverage correlations for actionable insights!
Unlock the power of data analysis with our Correlation Coefficient Calculator. Discover how to quantify relationships between variables, visualize trends, and make informed decisions. From finance to scientific research, this tool simplifies complex calculations. Ready to explore hidden patterns in your data? Learn how to leverage correlation analysis today!