Tag data visualization

Data visualization is a powerful technique for transforming complex information into clear, easily understandable graphical representations. This category offers a range of tools and resources to help businesses and professionals create compelling visual narratives from their data. From weighted average calculators for precise data analysis to quartile calculators for distribution insights, these tools enable users to uncover patterns, trends, and relationships within their datasets. Data visualization empowers decision-makers by presenting information in a visually appealing and accessible format, facilitating better understanding and more informed choices. Whether you’re analyzing financial data, market trends, or performance metrics, our data visualization tools can help you communicate your findings effectively and drive meaningful action. Explore our range of visualization options to unlock the full potential of your data and gain a competitive edge in your industry.

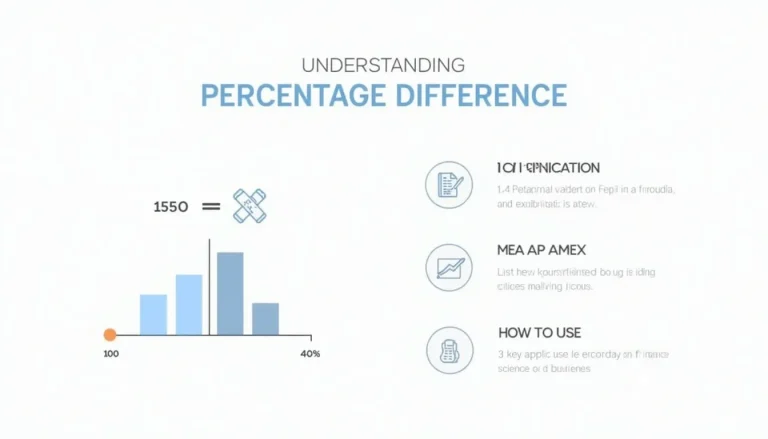
Percentage Difference Calculator: Compare Values with Precision

Discover the power of percentage difference calculations with our comprehensive infographic, showcasing its formula, applications, and practical usage.
Discover the power of our Percentage Difference Calculator! Compare values effortlessly, visualize results with charts, and gain insights across various fields. From finance to science, this versatile tool saves time and ensures accuracy. Unlock its potential for your data analysis needs. Learn how to leverage this calculator for smarter decision-making today!
Go toPercentage Difference Calculator: Compare Values with Precision

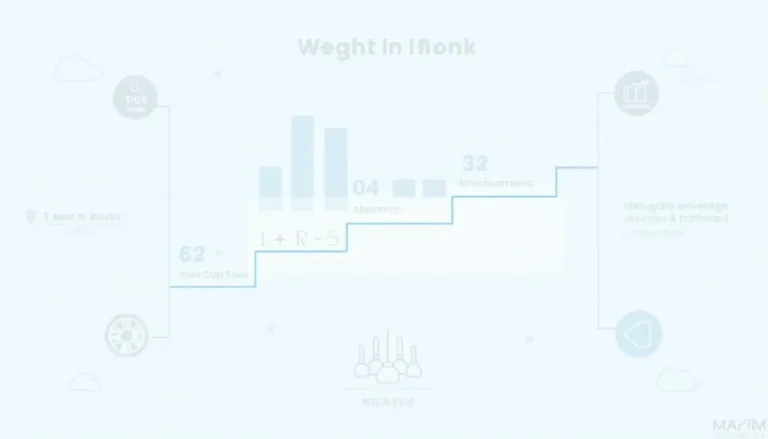
Weighted Average Calculator: Easy Tool for Precise Data Analysis

Discover the power of precise data analysis with our Weighted Average Calculator infographic – simplifying complex calculations for academia, finance, and business.
Unlock the power of data analysis with our Weighted Average Calculator. Simplify complex calculations, enhance decision-making, and gain deeper insights across various fields. From academic grading to financial analysis, this user-friendly tool streamlines your workflow and improves accuracy. Discover how weighted averages can revolutionize your approach to data interpretation!
Go toWeighted Average Calculator: Easy Tool for Precise Data Analysis

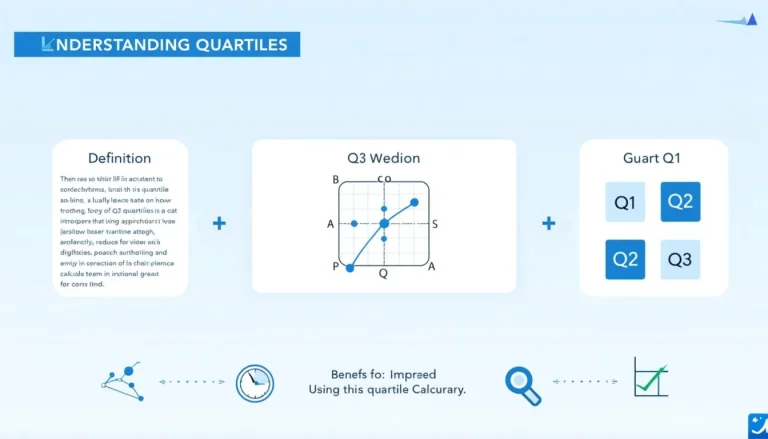
Quartile Calculator: Analyze Data Distribution with Ease

Unlock the power of data analysis with our comprehensive guide to understanding quartiles and leveraging our quartile calculator.
Unlock the power of data analysis with our Quartile Calculator! Discover how this versatile tool can revolutionize your understanding of datasets, from salary distributions to stock prices. Learn to identify outliers, visualize data spread, and make informed decisions. Ready to dive deeper into your data's story? Find out how quartiles can transform your analysis!
Go toQuartile Calculator: Analyze Data Distribution with Ease