Correlation Coefficient Calculator: Analyze Relationships Between Variables

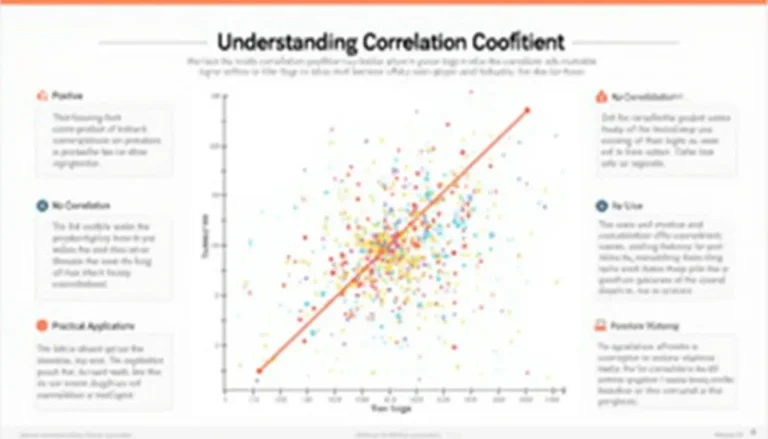
A scatter plot is a powerful data visualization tool that reveals relationships between two variables by displaying data points on a two-dimensional graph. This essential statistical tool helps analysts and researchers identify patterns, trends, and correlations within their dataset, making it invaluable for data-driven decision making. By plotting individual data points, scatter plots clearly show whether variables have positive, negative, or no correlation, enabling businesses to make informed strategic choices based on data relationships. When used alongside analytical tools like correlation coefficient calculations, scatter plots provide a comprehensive understanding of data relationships and help validate statistical findings. Whether you’re analyzing sales patterns, market trends, or performance metrics, scatter plots offer an intuitive way to communicate complex data relationships to stakeholders. Start creating scatter plots today to uncover meaningful insights in your data and drive better business outcomes.
