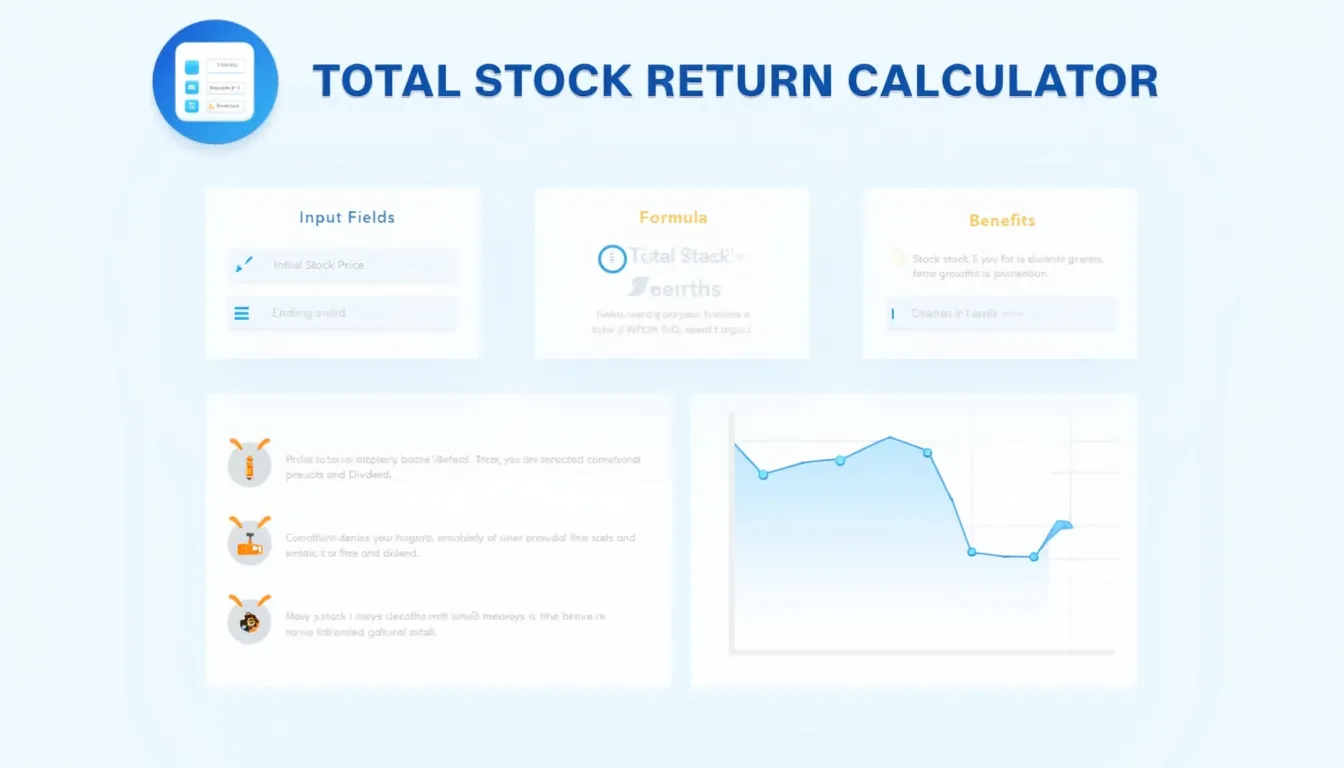
Total Stock Return Calculator: Measure Your Investment Performance

Unlock the true potential of your investments with our Total Stock Return Calculator. Discover how dividends and price changes impact your overall returns, compare different stocks effortlessly, and make data-driven decisions. Ready to revolutionize your investment strategy? Learn how this powerful tool can transform your portfolio management today!

Total Stock Return Calculator

Enter the initial price of the stock

Enter the final price of the stock

Enter the total dividends paid

Welcome to our comprehensive guide on the Total Stock Return Calculator, a powerful tool designed to help investors assess the overall performance of their stock investments. This calculator provides valuable insights into the profitability of your stock holdings by considering both capital appreciation and dividend income.

How to Use the Total Stock Return Calculator Effectively

Our user-friendly Total Stock Return Calculator is designed to simplify the process of evaluating your stock investments. Follow these steps to make the most of this tool:

  1. Enter the Initial Stock Price: Input the price at which you purchased the stock or its value at the beginning of the evaluation period.
  2. Provide the Ending Stock Price: Enter the current stock price or its value at the end of your evaluation period.
  3. Input the Total Dividends: Enter the sum of all dividends received during the holding period.
  4. Click “Calculate”: The calculator will instantly compute your total stock return as a percentage.

The calculator uses the following formula to determine the total stock return:

$$ \text{Total Stock Return} = \frac{(\text{Ending Stock Price} – \text{Initial Stock Price}) + \text{Dividends}}{\text{Initial Stock Price}} $$

Understanding Total Stock Return: Definition, Purpose, and Benefits

Total stock return is a comprehensive measure of an investment’s performance that takes into account both the appreciation in stock price and any dividends received. This metric provides a holistic view of your investment’s profitability, allowing you to make more informed decisions about your portfolio.

Key Components of Total Stock Return

  • Capital Appreciation: The increase in the stock’s market value over time.
  • Dividend Income: The cash payments distributed to shareholders by the company.

By considering both these factors, total stock return offers a more accurate representation of your investment’s performance compared to looking at stock price changes alone.

Benefits of Using the Total Stock Return Calculator

Our Total Stock Return Calculator offers numerous advantages for investors of all levels:

  1. Comprehensive Performance Evaluation: Get a complete picture of your investment’s performance by factoring in both price appreciation and dividend income.
  2. Quick and Accurate Calculations: Save time and avoid manual calculation errors with our user-friendly tool.
  3. Informed Decision-Making: Use the results to compare different investments and make data-driven portfolio decisions.
  4. Historical Performance Analysis: Evaluate the performance of your stocks over different time periods to identify trends and patterns.
  5. Dividend Impact Assessment: Understand how dividends contribute to your overall returns, especially for income-focused investments.
  6. Portfolio Optimization: Identify your best and worst-performing stocks to guide future investment strategies.
  7. Risk-Return Analysis: Compare total returns against perceived investment risks to ensure your portfolio aligns with your risk tolerance.

Addressing User Needs and Solving Investment Challenges

The Total Stock Return Calculator addresses several key challenges faced by investors:

1. Overcoming Calculation Complexity

Many investors struggle with the mathematical complexities of calculating total returns, especially when dividends are involved. Our calculator simplifies this process, ensuring accurate results without the need for complex formulas or spreadsheets.

2. Providing a Holistic View of Investment Performance

By considering both price appreciation and dividends, the calculator offers a comprehensive view of investment performance. This holistic approach prevents investors from overlooking the significant impact that dividends can have on overall returns.

3. Facilitating Investment Comparisons

Comparing the performance of different stocks can be challenging, especially when they have varying dividend policies. The Total Stock Return Calculator standardizes this comparison by providing a single percentage figure that accounts for both growth and income.

4. Supporting Long-term Investment Strategies

For long-term investors, understanding the compounding effect of reinvested dividends is crucial. This calculator helps visualize the power of dividend reinvestment and encourages a focus on total return rather than short-term price fluctuations.

5. Enhancing Portfolio Management

By providing clear, quantifiable data on stock performance, the calculator aids in portfolio rebalancing and optimization. Investors can easily identify which stocks are outperforming or underperforming, guiding decisions on whether to hold, buy more, or sell.

Practical Applications and Use Cases

The Total Stock Return Calculator has numerous practical applications for various types of investors:

Example 1: Evaluating a Dividend Growth Stock

Suppose you purchased shares of a well-known dividend growth stock 5 years ago at $50 per share. The current stock price is $75, and you’ve received a total of $10 in dividends over the holding period.

  • Initial Stock Price: $50
  • Ending Stock Price: $75
  • Total Dividends: $10

Using the calculator, you’d find:

$$ \text{Total Stock Return} = \frac{($75 – $50) + $10}{$50} = 0.70 \text{ or } 70\% $$

This 70% return over 5 years translates to an annualized return of approximately 11.2%, showcasing the power of combining price appreciation with dividend income.

Example 2: Comparing High-Growth vs. Income Stocks

Let’s compare two stocks over a 3-year period:

Stock A (High-Growth):

  • Initial Price: $100
  • Ending Price: $150
  • Dividends: $0

Stock B (Income-Focused):

  • Initial Price: $100
  • Ending Price: $110
  • Dividends: $15

Using the calculator for both stocks:

Stock A Total Return:

$$ \frac{($150 – $100) + $0}{$100} = 0.50 \text{ or } 50\% $$

Stock B Total Return:

$$ \frac{($110 – $100) + $15}{$100} = 0.25 \text{ or } 25\% $$

While Stock A appears to outperform based solely on price appreciation, the inclusion of dividends shows that the gap in total return is smaller than it might initially appear.

Example 3: Assessing the Impact of Dividend Reinvestment

While our calculator doesn’t directly account for dividend reinvestment, it can help illustrate its potential impact. Consider a stock held for 10 years:

  • Initial Price: $50
  • Ending Price: $80
  • Annual Dividend: $2 (total $20 over 10 years if not reinvested)

Without reinvestment, the total return would be:

$$ \frac{($80 – $50) + $20}{$50} = 1.00 \text{ or } 100\% $$

However, if those dividends were reinvested to purchase additional shares, the actual return could be significantly higher. This example underscores the importance of considering dividend reinvestment in long-term investment strategies.

Frequently Asked Questions (FAQ)

1. What is total stock return?

Total stock return is a comprehensive measure of a stock’s performance that includes both the change in stock price (capital appreciation or depreciation) and any dividends paid to shareholders over a specific period.

2. Why is total stock return important?

Total stock return provides a more accurate picture of an investment’s performance than stock price alone. It’s particularly important for evaluating dividend-paying stocks, where a significant portion of the return may come from dividend income rather than price appreciation.

3. How often should I calculate the total return on my stocks?

While you can calculate total return at any time, it’s often most useful to do so annually or at regular intervals (e.g., quarterly) to track performance over time. It’s also valuable to calculate when considering selling a stock or rebalancing your portfolio.

4. Does the calculator account for stock splits?

This calculator doesn’t automatically adjust for stock splits. If a stock split occurred during your holding period, you should adjust the initial stock price accordingly before using the calculator.

5. Can I use this calculator for ETFs or mutual funds?

Yes, the principle of total return applies to ETFs and mutual funds as well. Use the fund’s NAV (Net Asset Value) in place of stock prices and include any distributions as dividends.

6. How does inflation affect total stock return?

This calculator provides nominal returns, which don’t account for inflation. To calculate real returns, you would need to adjust for inflation separately.

7. Can the total stock return be negative?

Yes, if the stock price decreases more than the dividends received, the total return can be negative, indicating a loss on the investment.

8. How does the total stock return relate to annualized return?

Total stock return shows the overall performance over the entire holding period. To compare investments held for different lengths of time, you’d need to calculate the annualized return, which this calculator doesn’t provide directly.

9. Is a higher total stock return always better?

While a higher return is generally preferable, it’s important to consider the level of risk taken to achieve that return. Sometimes, a lower but more consistent return might be more suitable for your investment goals and risk tolerance.

10. Can I rely solely on total stock return for making investment decisions?

While total stock return is a valuable metric, it shouldn’t be the only factor in your investment decisions. Consider other aspects such as the company’s financial health, industry trends, and your overall investment strategy.

Please note that we cannot guarantee that our webtool or the results from our webtool are always correct, complete, or reliable. Our content and tools might have mistakes, biases, or inconsistencies. Always consult with a qualified financial advisor before making important investment decisions.

Conclusion: Harness the Power of Total Stock Return Analysis

The Total Stock Return Calculator is an invaluable tool for investors seeking to gain a comprehensive understanding of their stock investments’ performance. By considering both capital appreciation and dividend income, this calculator provides a holistic view that can significantly enhance your investment analysis and decision-making process.

Key benefits of using our Total Stock Return Calculator include:

  • Accurate and comprehensive performance evaluation
  • Simplified comparison between different stocks or investment strategies
  • Enhanced understanding of the impact of dividends on overall returns
  • Support for long-term investment planning and portfolio optimization
  • Improved risk-return analysis capabilities

By regularly utilizing this tool, you can gain deeper insights into your investments, make more informed decisions, and potentially improve your overall portfolio performance. Remember, while total stock return is a crucial metric, it should be used in conjunction with other financial analyses and considerations to form a well-rounded investment strategy.

We encourage you to bookmark this page and make the Total Stock Return Calculator a regular part of your investment toolkit. Start using it today to unlock new perspectives on your stock investments and take your portfolio management to the next level!

Important Disclaimer

The calculations, results, and content provided by our tools are not guaranteed to be accurate, complete, or reliable. Users are responsible for verifying and interpreting the results. Our content and tools may contain errors, biases, or inconsistencies. We reserve the right to save inputs and outputs from our tools for the purposes of error debugging, bias identification, and performance improvement. External companies providing AI models used in our tools may also save and process data in accordance with their own policies. By using our tools, you consent to this data collection and processing. We reserve the right to limit the usage of our tools based on current usability factors. By using our tools, you acknowledge that you have read, understood, and agreed to this disclaimer. You accept the inherent risks and limitations associated with the use of our tools and services.
Create Your Own Web Tool for Free