Treynor Ratio Calculator: Measure Risk-Adjusted Portfolio Performance
Unlock the power of risk-adjusted returns with our Treynor Ratio Calculator. Discover how this essential tool can revolutionize your investment strategy, compare portfolios objectively, and optimize asset allocation. Learn to harness the Treynor Ratio for smarter, more informed financial decisions. Ready to elevate your investing game? Dive in now!
Treynor Ratio Calculator
Result:
★ Add to Home Screen
×
Follow these steps:
Tap the Share button at the bottom of the browser
Scroll down and tap “Add to Home Screen”
Tap “Add” to confirm
Follow these steps:
Tap the menu icon (⋮) in the top right
Tap “Add to Home screen”
Tap “Add” to confirm
Follow these steps:
Click the menu icon (⋮) in the top right
Click “Bookmarks”
Click “Bookmark this tab” or press Ctrl+D (Cmd+D on Mac)
Is this tool helpful?
Thanks for your feedback!
How to Use the Treynor Ratio Calculator Effectively
Our Treynor Ratio Calculator is designed to help investors and financial analysts measure the risk-adjusted performance of their investment portfolios. To use this tool effectively, follow these simple steps:
Enter the total returns of your investment or portfolio as a percentage in the “Total Returns (%)” field.
Input the risk-free rate of return as a percentage in the “Risk-Free Rate (%)” field.
Provide the beta coefficient of your investment or portfolio in the “Beta” field.
Click the “Calculate Treynor Ratio” button to obtain your result.
The calculator will then display the Treynor Ratio, which indicates how much excess return your portfolio generates for each unit of systematic risk.
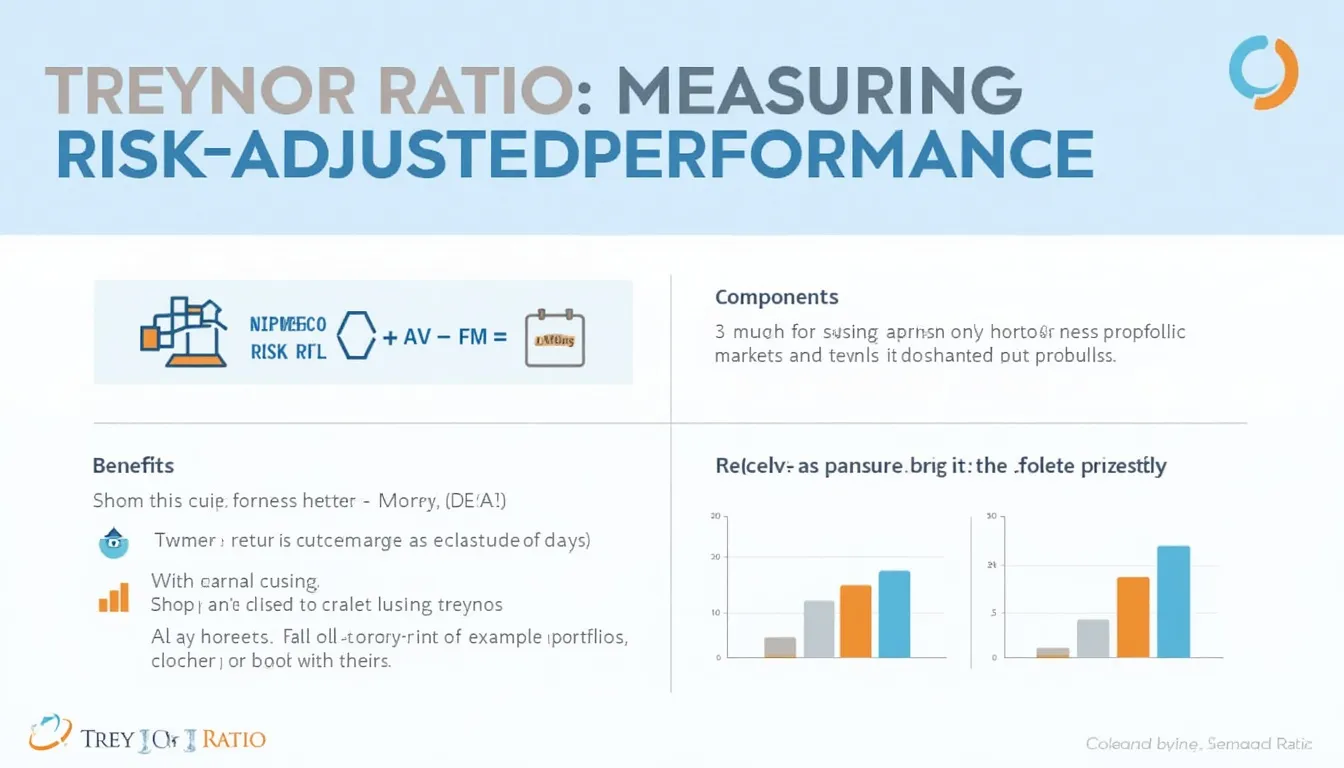
Understanding the Treynor Ratio: Definition, Purpose, and Benefits
The Treynor Ratio, also known as the reward-to-volatility ratio, is a performance metric used in the world of finance to evaluate the risk-adjusted returns of an investment portfolio. Developed by Jack Treynor in 1965, this ratio measures the excess return per unit of systematic risk, providing investors with a valuable tool for assessing portfolio performance.
The Treynor Ratio is calculated using the following formula:
The primary purpose of the Treynor Ratio is to help investors and portfolio managers evaluate the performance of their investments while considering the level of market risk taken. By comparing the excess return (portfolio return minus risk-free rate) to the portfolio’s beta, the Treynor Ratio provides insight into how well a portfolio is compensating investors for the systematic risk they are assuming.
Benefits of Using the Treynor Ratio Calculator
Incorporating the Treynor Ratio into your investment analysis offers several key benefits:
Risk-adjusted performance measurement: The Treynor Ratio allows you to compare portfolios with different risk levels on an equal footing by adjusting for systematic risk.
Benchmark comparison: You can easily compare your portfolio’s performance to market benchmarks or other investment options using a standardized metric.
Portfolio optimization: By identifying investments with higher Treynor Ratios, you can potentially improve your overall portfolio performance.
Diversification assessment: The ratio helps evaluate how well your portfolio is diversified by focusing on systematic risk rather than total risk.
Investment strategy evaluation: You can use the Treynor Ratio to assess the effectiveness of different investment strategies and make informed decisions about asset allocation.
Addressing User Needs and Solving Specific Problems
The Treynor Ratio Calculator addresses several common challenges faced by investors and financial professionals:
1. Comparing Portfolios with Different Risk Profiles
One of the primary difficulties in portfolio analysis is comparing investments with varying levels of risk. The Treynor Ratio solves this problem by providing a risk-adjusted performance measure, allowing for fair comparisons between portfolios with different risk profiles.
2. Evaluating Portfolio Managers
For investors working with portfolio managers, the Treynor Ratio offers a way to assess their performance objectively. By calculating the ratio for different managers’ portfolios, you can identify those who are generating the best risk-adjusted returns.
3. Optimizing Asset Allocation
The Treynor Ratio can guide investors in optimizing their asset allocation. By comparing the ratios of different asset classes or investment options, you can make informed decisions about where to allocate your capital for the best risk-adjusted returns.
4. Assessing the Impact of Diversification
Since the Treynor Ratio focuses on systematic risk (beta), it indirectly helps investors evaluate the effectiveness of their diversification strategies. A well-diversified portfolio should have a lower beta and potentially a higher Treynor Ratio.
Practical Applications and Example Calculations
Let’s explore some practical applications of the Treynor Ratio Calculator through example calculations:
Example 1: Comparing Two Mutual Funds
Suppose you’re considering investing in one of two mutual funds and want to compare their risk-adjusted performance:
Fund A: Returns = 12%, Beta = 1.2
Fund B: Returns = 10%, Beta = 0.8
Risk-free rate = 2%
Using the Treynor Ratio Calculator:
Fund A Treynor Ratio = (12% – 2%) / 1.2 = 8.33%
Fund B Treynor Ratio = (10% – 2%) / 0.8 = 10%
Despite Fund A having higher returns, Fund B has a higher Treynor Ratio, indicating better risk-adjusted performance.
Example 2: Evaluating Portfolio Performance Over Time
Let’s say you want to assess your portfolio’s performance over two years:
Your portfolio outperformed the market benchmark on a risk-adjusted basis, as indicated by the higher Treynor Ratio.
Frequently Asked Questions (FAQ)
1. What is a good Treynor Ratio?
A higher Treynor Ratio generally indicates better risk-adjusted performance. However, what constitutes a “good” ratio depends on the specific investment context and market conditions. It’s best to compare the Treynor Ratio of your portfolio to relevant benchmarks or peer investments.
2. How is the Treynor Ratio different from the Sharpe Ratio?
While both ratios measure risk-adjusted returns, the Treynor Ratio uses beta (systematic risk) as its risk measure, whereas the Sharpe Ratio uses standard deviation (total risk). The Treynor Ratio is more appropriate for well-diversified portfolios where systematic risk is the primary concern.
3. Can the Treynor Ratio be negative?
Yes, the Treynor Ratio can be negative. This occurs when the portfolio’s return is less than the risk-free rate, indicating underperformance relative to the risk-free investment.
4. How often should I calculate the Treynor Ratio for my portfolio?
It’s generally recommended to calculate the Treynor Ratio on a regular basis, such as quarterly or annually, to track your portfolio’s risk-adjusted performance over time. However, the frequency may vary depending on your investment strategy and market conditions.
5. What are the limitations of the Treynor Ratio?
The Treynor Ratio assumes that beta accurately measures risk, which may not always be the case. It also doesn’t account for unsystematic risk, making it less suitable for undiversified portfolios. Additionally, it relies on historical data, which may not predict future performance.
6. How do I interpret a change in the Treynor Ratio over time?
An increasing Treynor Ratio suggests improving risk-adjusted performance, while a decreasing ratio indicates declining performance relative to the level of systematic risk. However, it’s important to consider the broader market context and other performance metrics when interpreting these changes.
7. Can I use the Treynor Ratio to compare portfolios in different asset classes?
While the Treynor Ratio can be used to compare portfolios across different asset classes, it’s important to consider the limitations of such comparisons. Different asset classes may have inherently different risk-return characteristics, which may not be fully captured by beta alone.
8. How does the risk-free rate affect the Treynor Ratio?
The risk-free rate serves as a benchmark for the minimum return an investor expects without taking on risk. A higher risk-free rate will result in a lower Treynor Ratio, all else being equal, as it increases the hurdle for excess returns.
9. Is the Treynor Ratio suitable for all types of investments?
The Treynor Ratio is most suitable for well-diversified portfolios or investments where systematic risk is the primary concern. It may be less appropriate for individual stocks or highly concentrated portfolios where unsystematic risk plays a significant role.
10. How can I improve my portfolio’s Treynor Ratio?
To improve your portfolio’s Treynor Ratio, you can focus on increasing returns while maintaining or reducing systematic risk. This might involve selecting investments with higher alpha, improving diversification, or adjusting your asset allocation to optimize the risk-return trade-off.
Please note that we cannot guarantee that our webtool or results from our webtool are always correct, complete, or reliable. Our content and tools might have mistakes, biases, or inconsistencies.
Conclusion: Harnessing the Power of the Treynor Ratio
The Treynor Ratio Calculator is an invaluable tool for investors and financial professionals seeking to evaluate and optimize their portfolio performance. By providing a risk-adjusted measure of returns, it enables more informed decision-making and better portfolio management.
Key benefits of using the Treynor Ratio include:
Fair comparison of portfolios with different risk profiles
Evaluation of portfolio managers and investment strategies
Guidance for asset allocation and portfolio optimization
Assessment of diversification effectiveness
Benchmarking against market indices and peer investments
By incorporating the Treynor Ratio into your investment analysis toolkit, you can gain deeper insights into your portfolio’s performance and make more informed decisions about your investments. Remember that while the Treynor Ratio is a powerful metric, it should be used in conjunction with other financial analyses and considerations for a comprehensive evaluation of your investment strategy.
Take advantage of our Treynor Ratio Calculator today to start optimizing your portfolio’s risk-adjusted performance and make more informed investment decisions. Whether you’re a seasoned investor or just starting your financial journey, understanding and utilizing the Treynor Ratio can help you navigate the complex world of investments with greater confidence and precision.
Important Disclaimer
The calculations, results, and content provided by our tools are not guaranteed to be accurate, complete, or reliable. Users are responsible for verifying and interpreting the results. Our content and tools may contain errors, biases, or inconsistencies. We reserve the right to save inputs and outputs from our tools for the purposes of error debugging, bias identification, and performance improvement. External companies providing AI models used in our tools may also save and process data in accordance with their own policies. By using our tools, you consent to this data collection and processing. We reserve the right to limit the usage of our tools based on current usability factors. By using our tools, you acknowledge that you have read, understood, and agreed to this disclaimer. You accept the inherent risks and limitations associated with the use of our tools and services.