How to use the tool
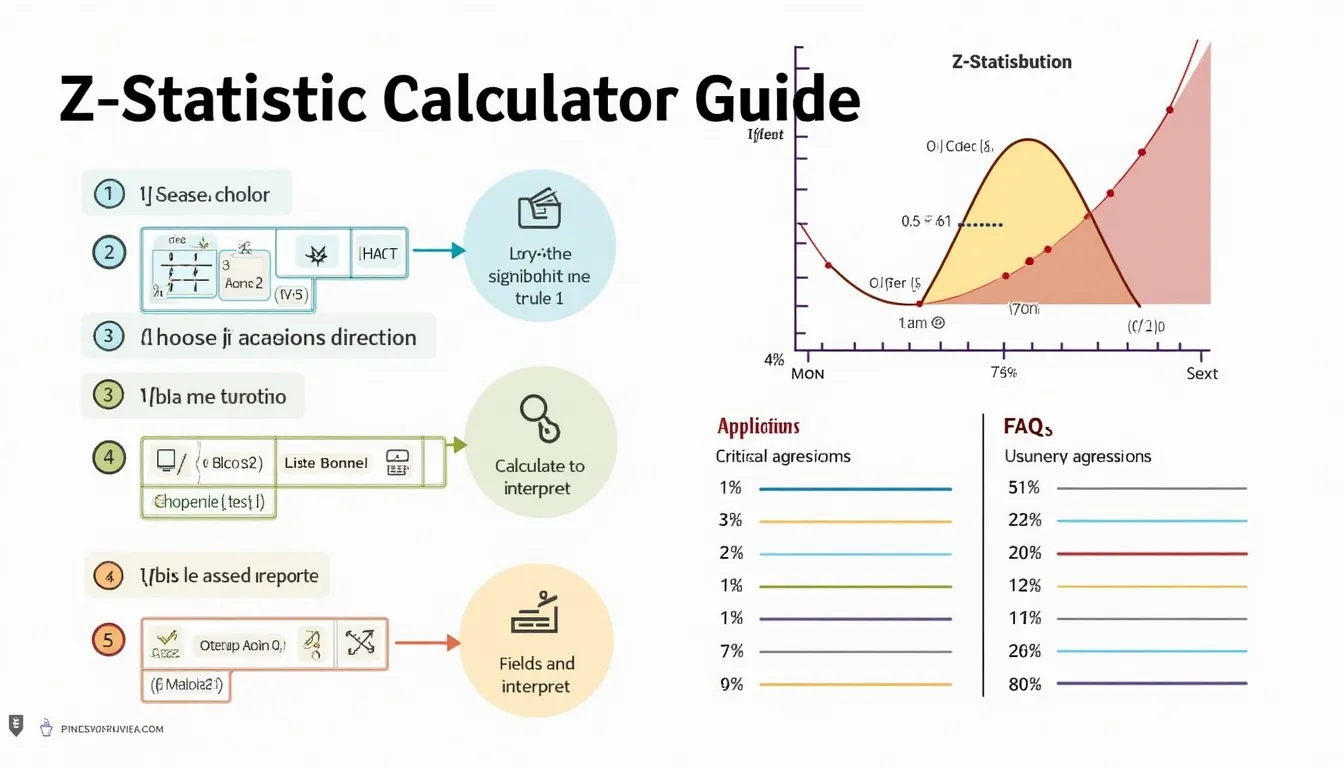
1. Pick your test type
- Means z-test – compare an average. Example: x̄ = 130, μ = 125, σ = 12, n = 36.
- Proportions z-test – compare a percentage. Example: p̂ = 0.58, p = 0.50, n = 180.
2. Choose the direction
- Two-tailed – detects any difference.
- Left-tailed – tests if the sample is smaller.
- Right-tailed – tests if the sample is larger.
3. Set your significance level (α)
Common choices: 0.05, 0.01, 0.10. Enter any value between 0 and 1.
4. Enter the data
For means
- Sample Mean (x̄)
- Population Mean (μ)
- Population Standard Deviation (σ)
- Sample Size (n)
For proportions
- Sample Proportion (p̂)
- Population Proportion (p)
- Sample Size (n)
5. Press “Calculate” and read the outputs
- Z-Statistic
- P-value
- Critical value(s)
- Decision – reject or fail to reject H₀.
Key formulas
- Means test: $$z= rac{\bar{x}-\mu}{\sigma/\sqrt{n}}$$
- Proportions test: $$z= rac{\hat{p}-p}{\sqrt{p(1-p)/n}}$$
- P-value (two-tailed): $$p=2\bigl[1-\Phi(|z|)\bigr]$$
- Critical value (two-tailed): $$z_{crit}=\pm\Phi^{-1}(1-α/2)$$
Worked examples
Example 1 – Means (two-tailed, α = 0.05)
- Data: x̄ = 130, μ = 125, σ = 12, n = 36.
- Compute: $$σ/\sqrt{n}=12/6=2$$ $$z=(130-125)/2=2.50$$
- P-value: 0.0124; critical values: ±1.96. Reject H₀.
Example 2 – Proportions (two-tailed, α = 0.05)
- Data: p̂ = 0.58, p = 0.50, n = 180.
- Std error: $$\sqrt{0.5(0.5)/180}=0.0373$$ $$z=(0.58-0.50)/0.0373=2.15$$
- P-value: 0.0319; critical values: ±1.96. Reject H₀.
Quick-Facts
- The standard normal distribution has μ = 0 and σ = 1 (NIST e-Handbook, 2012).
- A z-test for means is typically valid when n ≥ 30 or σ is known (OpenStax “Intro Stats”, 2022).
- Common α levels: 0.05 in social sciences, 0.01 in genomics (ASA Statement on p-Values, 2016).
- Proportion tests need np and n(1-p) ≥ 10 (UCLA Statistical Consulting, 2023).
FAQ
What is a z-statistic?
A z-statistic tells you how many standard deviations your sample result lies from the null-hypothesis value (NIST, 2012).
When should you use a one-sample z-test for means?
Use it when the population standard deviation is known and the sample is random and ≥ 30 observations (OpenStax, 2022).
How large must the sample be for a proportion z-test?
You need at least 10 expected successes and 10 failures so the normal approximation is reasonable (UCLA Statistical Consulting, 2023).
Why pick a one-tailed test?
Choose one-tailed when your research question predicts a specific direction; it gives more power in that direction (Gerard & Smith, Journal Stats Ed, 2021).
How do you interpret the p-value?
The p-value gives the probability of observing a statistic as extreme as yours if the null hypothesis is true (ASA, 2016).
What if σ is unknown?
Replace the z-test with a t-test that uses the sample standard deviation and t-distribution (NIST, 2012).
Does non-normal data matter?
For large samples (n ≥ 30), the Central Limit Theorem makes the z-test robust to non-normality (Rice, “Mathematical Statistics”, 2020).
Can I change α after seeing results?
No—α must be set before analysis to avoid inflating Type I error (ASA, 2016).
Is this tool helpful?
Important Disclaimer
The calculations, results, and content provided by our tools are not guaranteed to be accurate, complete, or reliable. Users are responsible for verifying and interpreting the results. Our content and tools may contain errors, biases, or inconsistencies. Do not enter personal data, sensitive information, or personally identifiable information in our web forms or tools. Such data entry violates our terms of service and may result in unauthorized disclosure to third parties. We reserve the right to save inputs and outputs from our tools for the purposes of error debugging, bias identification, and performance improvement. External companies providing AI models used in our tools may also save and process data in accordance with their own policies. By using our tools, you consent to this data collection and processing. We reserve the right to limit the usage of our tools based on current usability factors.


